Global Temperature Records – Old and New
Earlier this week a Journal of Geophysical Research paper detailed the latest updates to the Global Historical Climatology Network (GHCN). The network is a source of temperature measurements from around the globe that is used to work out the average global temperature trend.
The release of the paper has coincided with the findings of the Berkeley Earth Surface Temperature (BEST) study, made public yesterday. So it seems the ideal time for a quick recap on how average global temperature records are produced, and how the BEST study differs:
How do scientists measure temperature at the Earth’s surface?
Systematic measurements in inhabited regions of the world began in the 19th century, and have been complied into the GHCN. These days, thermometer readings at meteorological stations, polar research stations and on ships and buoys provide direct measurements of surface temperature on land and at sea. Monthly updates are now provided through the World Meteorological Organisation’s CLIMAT reporting system.
The temperature of the lower atmosphere can be determined from satellite observations. These are not direct measurements – the satellites monitor microwave radiation, from which they can infer temperature.
Who produces global temperature trends?
Three main research groups produce records of average global temperature using direct measurements at the earth’s surface.
Two of the groups are based in the USA: the NOAA National Climatic Data Center (NCDC), and the NASA Goddard Institute for Space Studies (GISS). The third, HadCRUT, is produced by a collaboration between the UK Met Office Hadley Centre and the Climatic Research Unit at the University of East Anglia.
The Japanese Meteorological Agency ( JMA) also provides a global temperature record.
Two satellite records of lower atmospheric temperature come from the University of Alabama in Hunstville (UAH) and Remote Sensing Systems (RSS). The two groups use the same satellite data with different methods to determine temperature.
How do the three main groups compile global temperature records?
Producing a global temperature record is not as straightforward as just taking an average of all the measured temperatures over time. This is because the stations are not evenly spread over the globe, plus some stations have breaks in their measurements or have poor data.
Stations can also be affected by non-climatic changes. For example, it is well established that built-up, urban areas can be warmer than the surrounding countryside – the ‘Urban Heat Island’ (UHI) effect.
The three main research groups all use data from weather stations around the globe, with the principal source for each group being the GHCN, supplemented by additional sources. The precise station make-up of each temperature record varies however according to the different methodologies that they use.
The groups use different methods to ensure quality control of the data, and to adjust any artificial bias from phenomena such as the UHI effect. For example, GISS identify urban and rural areas and compare temperatures from neighbouring urban and rural areas to determine any UHI effect. HadCRUT simply assume UHI adds a slight warming error to their temperature trend and add that on.
The datasets for the land surface are then combined with temperature data for the sea surface. The researchers split the surface of the globe into grid boxes and calculate a temperature average for each grid box. The methods used by each research group for these processes are different. See our Global Temperatures profile for more details on these processes.
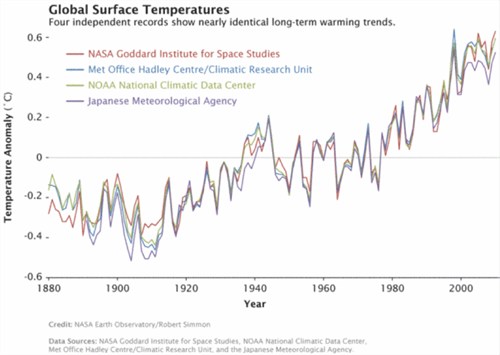
Do all of the different temperature records show the same trend?
The different temperature records show very similar trends. This is clearly demonstrated by the following graph, which compares the GISS, NCDC, HadCRUT and JMA trends:
The two satellite records also provide a very similar trend to the surface temperature trend, as shown in this graph:
Credit: Robert Rhode, Global Warming Art
How does the BEST study differ?
Despite studies (here and here for example) showing that UHI has a minimal effect on the overall temperature trend, climate skeptic commentators have claimed that scientists have underestimated the UHI effect, and that they don’t take poorly sited stations into account. The BEST study set out to answer these concerns.
The BEST study uses a different averaging methodology to the NCDC, GISS and HadCRUT. BEST boast that their method can use temperature records that are short and discontinuous, and it does away with the grid box system.
Another difference is that NCDC, GISS and HadCRUT use the GHCN as their main data set, supplemented by other sources. The GHCN consists of average monthly temperatures from nearly 7300 meteorological stations, and requires that stations provide long, reasonably complete temperature records. The three main compilers use as much and as reliable data as possible.
For example, HadCRUT currently uses data from around 4500 stations. Their methodology rejects stations with less than 15 years of data and instead uses temperature data from various regional climate studies and archives in those regions. GISS uses around 6300 meteorological stations, along with Antarctic research stations.
However, their datasets are dwarfed by that of the BEST study, which has gathered data from nearly 40,000 unique stations (from 10 public sources).
BEST have so far only tried out their new averaging methodology on the NCDC dataset, but hope to try their methodology on their full dataset in the future. They have used the full dataset to determine the effects of UHI on the global temperature trend.
It should be noted that research has demonstrated that reliable global trends can be compiled from a worldwide network of fewer than 300 stations if the stations are well maintained.
A further difference is that the BEST study has so far only considered global land surface temperatures, and does not incorporate the sea surface temperature trend.
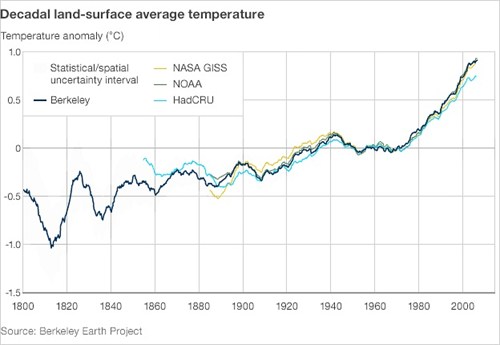
What does the BEST study show?
Despite the differences in methodology, BEST study shows a global temperature trend from land stations very similar to those of NCDC, GISS and HadCRUT:
Image - BEST land surface temp (note)
BEST researchers also tested a sample of 2000 stations that are not part of the GHCN and found a very similar trend to those found previously. The BEST study final report on UHI finds, unsurprisingly, that its effect on the global land temperature trend is minimal. We have more about the BEST UHI study here.
The BEST study publications have yet to be peer-reviewed. But their findings are consistent with a wealth of scientific research already conducted in this area. The big question now is whether this will lay to rest the concerns of climate skeptics about the reliability of global temperature records.