众所周知,剧烈的火山喷发会导致地表气温突然下降,多次喷发则会在几十年乃至几个世纪的时间尺度上影响气候变率。
当火山喷发将二氧化硫注入平流层时,会形成气溶胶,从而阻挡阳光到达地球表面。
与人类对气候变化的影响不同,后者发生缓慢且可以在各种社会经济情景下被纳入气候模型进行考量。火山喷发具有突发性,这给气候预测带来了挑战。
目前科学家尚无法预测火山喷发的发生时间、地点以及二氧化硫的排放量。
那么,在进行未来气候预测时,如何考虑火山喷发对气候的影响呢?
在我们最近发表于《通讯-地球与环境》(Communications Earth & Environment)的研究中,我们表明火山喷发对全球气温预测的不确定性产生了重大影响。
我们的研究结果发现,如果将偶发的火山喷发纳入气候预测,突破《巴黎协定》所设定的1.5C升温上限的时间会略有延迟,但与此同时,未来几十年也将出现更多快速升温和降温的时期。
气候科学家将火山喷发对气候的影响——主要是通过释放出二氧化硫气体进入大气——称为“火山强迫”(volcanic forcing)。
当前的气候模型在进行未来预测时采用一个恒定的火山强迫值,该值是根据1850年至今的历史平均强迫值计算得出的。
国际耦合模式比较计划(CMIP)也是如此,这项全球模型工作为政府间气候变化专门委员会(IPCC)发布的重要评估报告提供基础数据。
然而,这种方法存在显著局限。
首先,历史平均强迫值无法表示火山爆发的偶发性。
大规模火山喷发呈零星分布——有时好多事件集中发生在某几个十年内,有时两个事件之间则可能相隔上百年。
此外,与数千年尺度的记录相比,从1850年至今的参考时期中,发生过的大规模喷发事件 ——指排放超过3太克(Tg)二氧化硫的喷发事件——相对较少。
最后,早期国际耦合模式比较计划气候模型中所使用的火山强迫重建数据并未包含排放量少于3太克二氧化硫的中小规模喷发。
这是因为这些喷发在1980年卫星时代开始之前大多未被探测到。然而,这些体量较小但发生频率更高的喷发事件,在长期火山强迫中贡献了30%至50%。
传统上,气候科学家认为气候预测中主要存在三种不确定性来源:内部变率、模型不确定性和情景不确定性。
其中,“内部”变率是指气候系统内部自然产生的波动,如厄尔尼诺现象;模型不确定性是指不同气候模型之间结果的差异;情景不确定性则涉及未来几十年全球可能的发展路径。
我们的研究结果表明,火山喷发应被明确视为气候预测中第四个重要的不确定性来源。
为了探究在考虑火山强迫不确定性的情况下,气候预测会发生怎样的变化,我们的研究采用了一种概率方法,这一方法建立在Bethke等人于2017年提出的研究基础之上。
为此,我们构建了“随机强迫情景”,其本质是1000种延续至本世纪末的火山活动可能时间线预测。
这些情景基于冰芯中记录的过去1.15万年火山活动历史,以及卫星观测和地质证据。每个情景都呈现了不同的喷发强度、地点、时间和频率的组合。
(在数学中,“随机”系统是指结果包含随机性或不确定性的系统,因此不可预测;这与“确定性”系统相对,后者的结果可以通过初始条件和一套规则或方程完全预测。)
随后,我们利用2015至2100年期间的随机火上强迫和历史平均火山强迫模拟气候预测,研究共享社会经济路径(SSPs)中三种不同排放情景下的升温变化:低排放情景(SSP1-1.9)、与现行气候政策相符的中等排放情景(SSP2-4.5)、非常高排放情景(SSP5-8.5)。
在这一步中,我们使用了一种称为FaIR的简化气候模型,也称“模拟器”。
通过模拟1000种不同的火山未来情况,我们发现在21世纪未来时期火山喷发所引起的气候不确定性,可能超过同期气候系统本身的内部变率。
我们还发现,到2030年代,火山喷发可能占全球气温预测总不确定性的三分之一以上。
下图中能看到这些结果。图中展示了不同来源对总不确定性的影响。火山为橙色、内部变率为深蓝色、气候模型响应为黄色,未来人类排放情景为绿色。
我们的模拟结果表明,在气候预测中纳入可能的火山活动时间线后,短期内突破《巴黎协定》设定的1.5C升温上限的概率略有下降。
根据不同的排放情景,相较于使用恒定火山强迫的预测,模拟发现超过1.5C升温上限的概率下降了4%至10%。
尽管这一结果听起来似乎令人鼓舞,但未来的火山活动并不能在长期缓和由人类引起的全球变暖。
1815年坦博拉火山的喷发事件就是一个强有力的例证。这次喷发使全球气温平均下降了约0.8C,带来了“无夏之年”,导致欧洲、北美和中国大范围的作物歉收和饥荒。
火山喷发带来的降温效应是短暂的,通常只持续几年,其并不会改变由人类排放所导致的长期变暖趋势。
我们的研究发现,即使考虑多种可能的未来火山活动,在除了最低排放路径以外的所有情景中,全球变暖仍将在几十年内超过1.5C。
即便21世纪火山活动频繁,其对全球变暖的抵消作用也仅占很小一部分——这意味着减排对于实现长期气候目标仍然至关重要。
下方图表展示了在三种排放情景下,使用随机火山强迫(实线)与恒定火山强迫(虚线)时超过1.5C的概率(上图),以及两种强迫方式之间的概率差异(下图)。
我们的研究提供的另一个重要发现是:一旦将火山强迫的变率纳入考虑,将更有可能出现极端温暖和寒冷的十年期。
在中等排放情景下,我们发现出现负向十年期趋势——即全球表面温度在某个十年内平均下降——的概率增加了10%到18%。
与此同时,出现极端温暖十年期的概率也随之增加,这反映出火山强迫的变率会同时提高变暖和变冷极端事件发生的可能性。
这一结果凸显了火山喷发如何在十年时间尺度上对全球气温趋势带来显著的波动。
了解火山对气候的影响,对于全面评估农业、基础设施和能源系统在未来所面临的风险至关重要。
使用全面的地球系统模型运行数千种火山情景并不切实际,因为这需要极高的计算资源。但与此同时,当前的方法也存在上文提到的显著局限。
不过,在未来的气候模型工作中,仍有折中方案可行。
即将开展的下一阶段气候建模实验——即CMIP7情景模式比较计划——可以采用更具代表性的“平均”火山强迫基线,这一基线纳入了历史记录中常被遗漏的小型喷发事件的影响。这一偏差现已在用于下一代气候模型模拟的历史火山强迫数据集中得到纠正。
此外,建模团队还应额外运行包含高频和低频未来火山活动的情景,以全面捕捉火山不确定性对气候预测的影响范围。
虽然人类导致的温室气体排放仍是气候变化的主导因素,但若能妥善考虑火山活动的不确定性,将有助于我们获得更全面的未来气候图景及其对社会的潜在影响。
EXTREME FLOODING: At least 120 people died and 173 remain missing one week after flash floods in Texas, NBC News reported. The floods were “one of the deadliest weather events in recent American history”, the New York Times said. The newspaper said it is “too early to say with certainty” the role of climate change, but this type of extreme rainfall is “precisely the kind of phenomenon that scientists say is becoming more common because of global warming”.
STORM CONDITIONS: Bloomberg noted that drought, the “abnormally hot Gulf of Mexico” and other factors fuelled the “storm that spawned the floods” in Kerr county. Climate scientists told Inside Climate News that the “torrential downpours on 4 July exemplify the devastating outcomes of weather intensified by a warming atmosphere”.
CUTS QUESTIONED: The Guardian reported on a warning from experts that such floods could become the “new normal” as “Donald Trump and his allies dismantle crucial federal agencies that help states prepare and respond to extreme weather and other hazards”. E&E News reported that “forecasts and warnings largely worked during the catastrophe in Texas”, but that “those systems are expected to degrade as Trump’s cuts take hold”.
HIMALAYAN FLOODS: Elsewhere, heavy rainfall “battered” two Himalayan states in India, “leading to widespread damage, disruption and loss of life”, India Today reported. Pakistan’s Dawn newspaper reported that “record high summer temperatures” have “accelerated the melting of glaciers”, leading to deadly flooding in some parts of the country.
RAGING HEAT: Around 1,500 of the 2,300 heat deaths during the heatwave that “seared Europe at the end of June” can be attributed to climate change, according to World Weather Attribution analysis covered by the Guardian. The newspaper said that Milan was the “hardest-hit city” and that 88% of the “climate-driven deaths” were in people aged over 65.
MORE EXTREMES: Extreme heat continued to affect much of Europe this week. In Catalonia, Spain, more than 18,000 people were ordered to remain indoors as a “wildfire raged out of control, consuming almost 3,000 hectares of vegetation”, Reuters said. Marseille airport closed as a major wildfire encroached on the southern French city, Le Monde reported.
‘CLIMATE DELAYERS’: Meanwhile, a “far-right” political group successfully outbid other groups to lead negotiations for the EU’s next climate target on behalf of the European parliament, according to Politico. This role for the Patriots for Europe group “give[s] the far right unprecedented influence” over the 2040 target, the outlet said, adding that it “strongly opposes the EU’s climate policies”. An early attempt to curb the bloc’s influence failed, Reuters said.
The percentage of global wind and solar projects under construction that are located in China, according to a Global Energy Monitor report.
(For more, see Carbon Brief’s in-depth daily summaries of the top climate news stories on Monday, Tuesday, Wednesday, Thursday and Friday.)
Water levels soared by more than eight metres in just over two hours on the Guadalupe River within an area known as “flash flood alley” in Texas on 4 July. The resulting floods caused devastation for people in nearby homes and summer camps. Satellite imagery in NBC News showed the scale of the impact. Carbon Brief examined the potential role of climate change in the flood and how it was covered by global media.
This week, Carbon Brief looks at the significance of Ireland becoming the latest European country to end coal-powered electricity.
Ireland has joined the UK and a slew of other nations in burning its last lump of coal – the most polluting fossil fuel – to generate electricity.
Coal use ceased on 20 June at Moneypoint, the country’s last coal-burning power station, in line with a 2019 government pledge.
Spain and Italy are expected to become the next European countries to leave behind coal power, according to Beyond Fossil Fuels.
Ireland’s move offers an important “signal” for the country’s energy transition, said Margie McCarthy, the director of research and policy insights at the Sustainable Energy Authority of Ireland (SEAI). She told Carbon Brief:
“We’ve put in place a lot of really ambitious legislation and climate action plans, but we are still more than 80% reliant on fossil fuels across all of our energy demands…Coal is a particularly carbon-intensive fossil fuel, so any movement away from that is a good step forward.”
Gas (42.1% in 2024) and renewables (39.6%) generate the vast majority of Ireland’s electricity. Coal, despite its overall decline, experienced a mini-comeback in 2021 and 2022 – broadly in line with EU trends when gas prices soared as Russia restricted supplies and countries later dropped Russian fossil fuels following the country’s invasion of Ukraine.
The share of Ireland’s electricity coming from coal increased from 4% in 2020 to 14% in 2021. This fluctuated again in recent years, dropping to 4.6% in May 2025.
The ESB, the state-owned energy company that runs Moneypoint, was criticised in 2022 for resuming shipments from a controversial Colombian mine as an alternative to Russian coal. The company had stopped buying coal from the Cerrejón mine in 2018.
Cerrejón is “Latin America’s largest open-pit coal mine” – six times the size of Manchester, a recent article from the Bureau of Investigative Journalism said. Ireland’s national broadcaster RTÉ reported in 2024:
“According to local communities, lawyers’ organisations and court rulings, in its four decades of operation it has driven an environmental crisis that has destroyed the health, lives and culture of many thousands of Indigenous people.”
An ESB spokesperson told Carbon Brief that it sourced a “limited amount of coal from Cerrejón between April 2022 and August 2023”.
Now that coal use has wound down, Moneypoint will remain available to generate electricity using oil on a back-up basis until 2029.
The ESB “expects low levels of running of the plant going forward”, a spokesperson said.
The company plans to turn Moneypoint into a “green energy hub”, with a major offshore windfarm, a wind turbine construction hub and a green hydrogen facility on site.
Looking at Ireland’s ongoing energy transition, McCarthy said that, although gas still plays a “significant” role, increases in wind, solar and electricity interconnection are “good signals to move in the right direction”. She added:
“We just need to keep the pace going. We need to accelerate quicker…and that we make sure we’re managing demand while we are trying to accelerate that pace.”
A major cause of Ireland’s growing electricity demand is data centres, which consumed more than one-fifth of the country’s electricity supplies in 2024 – more than all urban households.
Ireland has become an “EU pioneer of data centres” thanks to “its low taxes, temperate climate and fibre cable access to the US and Europe”, according to the Financial Times.
McCarthy highlighted the importance of ensuring that “data centre demand is not undoing the renewable energy share, or the final energy consumption reductions that are required as part of our targets and obligations”. She added:
“It’s very fair to say that the efficiency measures in data centres have been significant…But the issue is that the demand is outpacing any efficiency measures that are being introduced.”
OIL TO LITHIUM: A Climate Home News article looked at the challenges facing Nigeria’s efforts to “supply refined lithium to the electric vehicle battery industry”.
PODCAST CHAT: The Rest is Politics podcast spoke to the UK Climate Change Committee chief executive, Emma Pinchbeck, about net-zero and the energy transition.
BRRR: A BBC News “in depth” article explored the growing “battle” for control over the Arctic, along with the security challenges from climate change and other issues in “one of the world’s coldest places”.
DeBriefed is edited by Daisy Dunne. Please send any tips or feedback to debriefed@carbonbrief.org.
This is an online version of Carbon Brief’s weekly DeBriefed email newsletter. Subscribe for free here.
The disaster unfolded after a severe rainstorm caused the Guadalupe River to swell to its second-greatest height on record.
Headlines have been dominated by the death of 27 children and counsellors from a summer camp for girls near the banks of the river.
In the aftermath of the flooding, many news outlets questioned whether the Trump administration’s decision to cut staff from the federal climate, weather and disaster response services may have impacted the emergency response to the disaster.
However, others defended the agency’s actions, saying that the appropriate warnings had been issued.
Scientists have been quick to point out the role of climate change in driving more intense rainfall events.
A rapid attribution analysis found “natural variability alone” could not explain the extreme rainfall observed during the “very exceptional meteorological event”.
Meanwhile, social media has also been awash with misinformation, including claims that the floods were caused by geoengineering – an argument that was quickly dismissed by officials.
In this article, Carbon Brief unpacks how the flood unfolded, the potential role of climate change and whether advanced warnings were affected by funding cuts to key agencies.
The flash flooding began in the early hours of the morning on Friday 4 July, with early news coverage focusing on Guadalupe River in Kerr County.
According to BBC News, the US National Weather Service (NWS) reported a “swathe of around 5-10 inches (125-250mm) of rainfall in just three to six hours across south-central Kerr County”, equivalent to “around four months of rain [falling] in a matter of hours”.
The slow-moving weather system was fed by moisture from the remnants of Tropical Storm Barry, which had brought flooding to Mexico, before tracking north as it died out, the outlet explained.
Kerr County is a “hillier part of Texas than surrounding counties”, meaning that “moisture-laden air was forced upwards, building huge storm clouds”, the article noted:
“These storm clouds were so large they effectively became their own weather system, producing huge amounts of rain over a large area.”
Prof Hatin Sharif, a hydrologist and civil engineer at the University of Texas at San Antonio, explained in an article for the Conversation why Kerr County is part of an area known as “flash flood alley”:
“The hills are steep and the water moves quickly when it floods. This is a semi-arid area with soils that don’t soak up much water, so the water sheets off quickly and the shallow creeks can rise fast.”
He added that Texas as a whole “leads the nation in flood deaths” – by a “wide margin”.
As the rain lashed down, the “destructive, fast-moving waters” of Guadalupe River rose by more than eight metres just before daybreak on Friday, said the Associated Press, “washing away homes and vehicles”.
The graph below shows the dramatic rise of water levels of the Guadalupe River in the early hours of the morning of 4 July, as measured by a gauge in Hunt.
The Washington Post reported that the river reached its “second-greatest height on record…and higher than levels reached when floodwaters rose in 1987”. It added that “at least 1.8tn gallons of rain” fell over the region on Friday morning.
The floodwaters swept through camps, resorts and motorhome parks along the banks of Guadalupe River for the Fourth of July weekend.
A timeline of events by NPR reported that “boats and other equipment that was pre-positioned started responding immediately”.
The article quotes Texas lieutenant governor Dan Patrick, who said there were 14 helicopters, 12 drones and nine rescue teams in action – as well as “swimmers in the water rescuing adults and children out of trees”. He added that there were 400 to 500 people on the ground helping with the rescue effort.
By Saturday 5 July, more than 1,000 local, state and federal personnel were on the ground helping with the rescue operation, NPR said.
In the days that followed, further periods of heavy rainfall meant that flood watches remained in place for much of the weekend, said Bloomberg.
Newspapers and online outlets were filled with images from the area. For example, the Sunday Times carried photos and video footage of the floods, while BBC News had drone footage of the “catastrophic flooding”.
The floods have killed at least 119 people, according to the latest count reports by the Guardian:
“In Kerr county, the area that was worst affected by last Friday’s flood, officials said on Wednesday morning that 95 people had died. The other 24 people who have died are from surrounding areas. The Kerr county sheriff said 59 adults and 36 children had died, with 27 bodies still unidentified.”
There are also 173 people believed to still be missing, the Guardian said, including 161 from Kerr County specifically.
By the end of the day on Thursday 10 July, the death toll had risen to 121, according to CBS News.
Bloomberg noted that “some of the victims came from additional storms around the state capital Austin on 5 July”. It added that, according to officials, “no one had been found alive since 4 July, when the deluge arrived in the pre-dawn hours”.
BBC News reported that continuing rains following the initial flood “hamper[ed] rescue teams who are already facing venomous snakes as they sift through mud and debris”.
Headlines have been dominated by the death of 27 children and counsellors from Camp Mystic – a 700-acre summer camp for girls, which has been running for almost 100 years, noted the Guardian.
BBC News reported that “many of the hundreds of girls at the camp were sleeping in low-lying cabins less than 500ft (150 metres) from the riverbank”.
Lieutenant governor Patrick “told of one heroic camp counsellor who smashed a window so girls in their pyjamas could swim out through neck-high water”, the outlet reported. He added that “these little girls, they swam for about 10 or 15 minutes” before reaching safety.
The Associated Press reported:
“Dozens of families shared in local Facebook groups that they received devastating phone calls from safety officials informing them that their daughters had not yet been located among the washed-away camp cabins and downed trees. Camp Mystic said in an email to parents of the roughly 750 campers that if they have not been contacted directly, their child is accounted for.”
The New York Times published images and videos of the aftermath at the summer camp.
Visiting the site on Sunday 6 July, Texas governor Greg Abbott tweeted that the camp was “horrendously ravaged in ways unlike I’ve seen in any natural disaster”.
In the immediate aftermath of the floods, US president Donald Trump, at his golf club in Bedminster in New Jersey, signed a major disaster declaration that freed up resources for the state, reported France24.
A preliminary estimate by the private weather service AccuWeather put the damage and economic loss at $18bn-$22bn (£13.2bn-£16.2bn), the Guardian reported.
Former president Barack Obama described the events as “absolutely heartbreaking”, reported the Hill. In a statement, former president George W Bush and his wife Laura – who was once a counselor at the camp – said that they “are heartbroken by the loss of life and the agony so many are feeling”, another Hill article reported.
American-born pontiff Pope Leo XIV also “voiced his sympathies”, reported another Guardian article. Speaking at the Vatican, he said:
“I would like to express sincere condolences to all the families who have lost loved ones, in particular their daughters who were in a summer camp in the disaster caused by flooding of the Guadalupe River in Texas.”
As the planet warms, extreme rainfall events are becoming more intense in many parts of the world.
This is principally because, according to the Clausius-Clapeyron (C-C) equation, the air is able to hold 7% more moisture for every 1C that the atmosphere warms, which means warmer air can release more liquid water when it rains.
For example, a recent study of the US found that the frequency of heavy rainfall at “durations from hourly to daily increased in 1949-2020”. It added that this was “likely inconsistent with natural climate variability”.
In addition, research indicates that, in some parts of the world, increases in the intensity of extreme rainfall over 1-3 hours are “stronger” than would be expected from the C-C scaling.
However, many other factors – such as local weather patterns and land use – affect whether extreme rainfall leads to flooding.
Local meteorologist Cary Burgess told Newsweek that “this part of the Texas Hill Country is very prone to flash flooding because of the rugged terrain and rocky landscape”. For example, the outlet notes, 10 teenagers died in flash floods in July 1987.
In the aftermath of the flooding in Texas, Dr Daniel Swain, a climate scientist at the University of California Agriculture and Natural Resources, told ABC News that there is “abundant evidence” that “highly extreme rain events” have “already increased considerably around the world as a result of the warming that’s already occurred”.
Prof Andrew Dessler from Texas A&M University wrote on climate science newsletter The Climate Brink that “more water in the air flowing into the storm will lead to more intense rainfall”. He added:
“The role of climate change is like steroids for the weather – it injects an extra dose of intensity into existing weather patterns.”
Dr Jennifer Francis, a climate scientist at the Woodwell Climate Research Center, told Bloomberg that Texas is “particularly flood-prone because the fever-hot Gulf of Mexico is right next door, providing plenty of tropical moisture to fuel storms when they come along”.
Many outlets pointed out the higher-than-average sea surface temperatures in the Gulf of Mexico. BBC News said:
“Sea surface temperatures in the Gulf of Mexico, where some of the air originated from, continue to be warmer than normal. Warmer waters mean more evaporation and so more available moisture in the atmosphere to feed a storm.”
Yale Climate Connections reported that sea surface temperatures were up to 1C above average in the central Gulf of Mexico. It said that human-caused climate change made these conditions up to 10 times more likely, according to the Climate Shift Index from Climate Central.
(This index gives the ratio of how common the temperature is in today’s climate, compared to how likely it would be in a world without climate change.)
Bloomberg was among a number of outlets to note that, in the run-up to the flooding, nearly 90% of Kerr County was experiencing “extreme” or “exceptional” drought. This meant the soil was hard and less able to soak in water when the intense rainfall arrived.
Just days after the event, rapid attribution group ClimaMeter published an analysis of the meteorological conditions that led to the flooding.
It stated that “conditions similar to those of the July 2025 Texas floods are becoming more favorable for extreme precipitation, in line with what would be expected under continued global warming”.
According to the analysis, the flooding was a “very exceptional meteorological event”. It explained that “meteorological conditions” similar to those that caused the floods are “up to 2 mm/day (up to 7%) wetter in the present than they have been in the past”. It added:
“Natural variability alone cannot explain the changes in precipitation associated with this very exceptional meteorological condition.”
The field of extreme weather attribution aims to find the “fingerprint” of climate change in extreme events such as floods, droughts and heatwaves.
ClimaMeter focuses on the atmospheric circulation patterns that cause an extreme event – for example, a low-pressure system in a particular region. Once an event is defined, the scientists search the historical record to find events with similar circulation patterns to calculate how the intensity of the events has changed over time.
The study authors warned that they have “low confidence in the robustness” of their conclusions for this study, because the event is “very exceptional in the data record”, so they do not have many past events to compare it to.
In its coverage of the attribution study, the Wall Street Journal highlighted some of the research’s limitations. It said:
“Remnant moisture from Tropical Storm Barry stalled over the region and repeatedly fed rainfall, making it hard to compare the weather pattern to historical data.”
The outlet quoted one of the study’s co-authors, Dr Davide Faranda, a scientist at France’s National Centre for Scientific Research, who said the data “nonetheless suggests that climate change played a role”.
Many other climate scientists have also linked the flooding to climate change.
For example, Dr Leslie Mabon, a senior lecturer in environmental systems at the Open University, told the Science Media Centre:
“The Texas floods point to two issues. One is that there’s no such thing as a natural disaster – and one area that disaster experts will be probing is what warnings were given and when. The second is that the pace and scale of climate change means extreme events can and do exceed what our infrastructure and built environment is able to cope with.”
Observers were quick to question how the response to the floods has been impacted by recent sweeping cuts to federal climate, weather and disaster response services by the Trump administration.
BBC News explained how staffing cuts overseen by the so-called Department of Government Efficiency – the initiative formerly led by Elon Musk – have reduced the workforce National Weather Service (NWS).
The news outlet reported that – since the start of the year – “most” probationary employees had their contracts terminated, 200 employees have taken voluntary redundancy, 300 opted for early retirement and 100 were “ultimately fired”.
(The Trump administration has also proposed a 25% cut to the budget of the National Oceanic and Atmospheric Administration (NOAA) – the agency which oversees the NWS – but this would not come into force until the 2026 financial year.)
The Independent was among a raft of publications to report the weather service had predicted 1-3 inches (2.5-7.6cm) of rain for the region – significantly less than the 10-15 inches (25-38cm) that ultimately fell.
CNN detailed how the first “life-threatening flash flooding warning” for parts of Kerr County – which would have triggered alerts to mobile phones in the area – was issued just past 1am on Friday morning by the NWS. This was 12 hours after the first flash flood warning and followed “several technical forecasts” issued on Thursday afternoon and evening with “increasingly heightened language”, it said.
In a recording obtained by ABC News, a firefighter is heard asking at 4:22am on 4 July if a “CodeRED” emergency alert could be issued to Hunt residents “asking them to find higher ground or stay home”. The dispatcher responds that a supervisor needs to approve the request.
The outlet reported that some residents received flood warnings from the CodeRED system within 90 minutes of the firefighter’s request, but others “did not receive their first alert until 10am” – at which point “hundreds had been swept away by the floodwaters”.
Other publications focused on staffing shortages at local branches of the weather service. The New York Times and Guardian were among the outlets who reported that “key staff members” had been missing at the two Texas NWS offices involved in forecasting and warning for the affected region. This included a “warning coordination” officer.
Writing on social media platform BlueSky, Dr Daniel Swain – the climate scientist from the University of California Agriculture and Natural Resources – said claims that the weather service “did not foresee” the floods were “simply not true”. He stated:
“This truly was a sudden and massive event and occurred at [the] worst possible time (middle of the night). But [the] problem, once again, was not a bad weather prediction: it was one of “last mile” forecast/warning dissemination.
“I am not aware of the details surrounding staffing levels at the local NWS offices involved, nor how that might have played into [the] timing/sequence of warnings involved. But I do know that locations that flooded catastrophically had at least 1-2+ hours of direct warning from NWS.”
Rick Spinrad, who led NOAA over 2021-25, speculated that the communication problems could have been caused by staffing shortages. He told the Hill:
“I do think the cuts are contributing to the inability of emergency managers to respond…The weather service did a really good job, actually, in getting watches and warnings and…wireless emergency alerts out.
“It is really a little early to give a specific analysis of where things might have broken down, but from what I’ve seen, it seems like the communications breakdown in the last mile is where most of the problem was.”
The Trump administration, meanwhile, was quick to push back on the suggestion that budget and job cuts to climate and weather services had aggravated the situation.
In an official statement provided to Axios, a White House spokesperson said criticisms of the NWS and funding cut accusations were “shameful and disgusting”. It added:
“False claims about the NWS have been repeatedly debunked by meteorologists, experts and other public reporting. The NWS did their job, even issuing a flood watch more than 12 hours in advance.”
Meanwhile, when a reporter asked Trump whether the administration would investigate whether recent cuts had led to “key” vacancies at the NWS, he responded that “they did not”.
Asked if he thought federal meteorologists should be rehired, Trump said:
“I would think not. This was the thing that happened in seconds. Nobody expected it. Nobody saw it.”
Media outlets highlighted how the disaster put a spotlight on the risks of forthcoming federal cuts to NOAA and the government’s plans to dismantle the Federal Emergency Management Agency (FEMA).
The Guardian reported on warnings that such floods could become the “new normal” as “Trump and his allies dismantle crucial federal agencies that help states prepare and respond to extreme weather and other hazards”.
Dr Samantha Montano, professor of emergency management at Massachusetts Maritime Academy, told the outlet.
“This is what happens when you let climate change run unabated and break apart the emergency management system – without investing in that system at the local and state level.”
CBS News reported on how, in 2017, Kerr County officials rejected proposals to install an outdoor warning system for floods on the grounds of cost. The outlet noted that neighbouring counties Guadalupe and Comal both have flood sirens in place.
As with many other natural disasters, the floods have been followed by a wave of fast-spreading online misinformation.
One of the most popular theories to have taken hold is that the floods were caused by cloud seeding – a form of geoengineering where substances are purposefully introduced into the clouds to enhance rainfall.
In a pair of Twitter posts, each viewed by several million people, one account claimed the state of Texas was “running seven massive cloud seeding programs” and asked: “Did they push the clouds too far and trigger this flood?”
It also linked the floods and cloud seeding operations conducted by Rainmaker Technology Corporation, a weather modification start-up partly funded by US billionaire Peter Thiel.
Rainmaker Technology Corporation CEO Augustus Doricko found himself in the eye of the social media storm, as social media users pointed to his organisation’s links to Thiel and shared a photo of the businessman with former US president Bill Clinton.
The cloud seeding theory received a major boost when it was promoted by Mike Flynn, Donald Trump’s former national security advisor and one of the “most integral figures in the QAnon movement”, according to the Guardian.
The theory was also picked up by existing and prospective Republican politicians.
The Daily Beast reported how Kandiss Taylor – a congressional candidate in Georgia – blamed the event on “fake weather” in a string of tweets. She wrote: “This isn’t just ‘climate change.’ It’s cloud seeding, geoengineering, & manipulation.”
Meanwhile, sitting Georgia congresswoman Marjorie Taylor Greene announced on Twitter that she had introduced a bill that “prohibits the injection, release, or dispersion of chemicals or substances into the atmosphere for the express purpose of altering weather, temperature, climate, or sunlight intensity”.
(This is not Taylor Greene’s first foray into weather manipulation conspiracies. In 2021, she postulated that Jewish bankers had started deadly fires in California in 2018 by firing a laser from space in order to benefit themselves financially.)
Meteorologists were quick to debunk the claims around cloud seeding. In a Facebook post, chief meteorologist for Texas news station ABC13 wrote:
“Cloud seeding cannot create a storm of this magnitude or size. In fact, cloud seeding cannot even create a single cloud. All it can do is take an existing cloud and enhance the rainfall by up to 20%.”
At a press conference on Monday, Texas senator Ted Cruz said there was “zero evidence of anything like weather modification”. He added:
“The internet can be a strange place. People can come up with all sorts of crazy theories.”
Theories about geoengineering were not the only form of misinformation to swirl online in the wake of the disaster.
Snopes reported how local outlet Kerr County Lead pulled a story about two girls rescued 30 metres up a tree two days after the flood event after the account was found to be false.
The story, which cited “sources on the ground”, was circulated widely on Twitter and replicated by other news outlets, including the Daily Mirror and Manchester Evening News in the UK. Both outlets subsequently deleted the articles.
In a retraction statement, the editor of Kerr County Lead said the story was a “classic tale of misinformation that consumes all of us during a natural disaster”.
Another widely-circulated story – debunked by Snopes – claimed that musician Eric Clapton would pay funeral expenses for the families of those killed.
The scale of flooding and the resulting death toll have prompted many news outlets to ask whether more could have been done to avoid the tragedy.
Newspapers in Texas highlighted perceived failures by local, state and federal authorities.
“Flash floods happen frequently enough in the Hill Country that many Texans rightly wonder whether at least some of the devastation and death…could have been prevented,” the Dallas Morning News said. “Answers must follow,” agreed the Austin American-Statesman.
An editorial in the San Antonio Express-News said there would likely be “plenty of finger-pointing”, arguing that “people will try to push narratives that serve political and personal agendas”. It added:
“The truth may reveal inevitability, failure or something in between.”
An editorial in the Houston Chronicle criticised “misguided decisions” by Trump to cut support for the “federal agencies that keep us safe from storms”. It stated:
“What will protect Texans is a fully staffed, fully supported weather service – with the scientists and infrastructure in place to warn us in time.”
While none of these Texan newspaper editorials pointed to a potential role for climate change in exacerbating the extreme rainfall, some of their wider reporting on the disaster did.
Other US news outlets, such as the New York Times, the Los Angeles Times and the Washington Post emphasised this link in their coverage.
“We hope this tragedy will lead to renewed support for the systems we’ve devised over the years to help prepare for and respond to natural disasters,” Louisiana’s New Orleans Advocate stated in an editorial, adding that “we all are vulnerable to increasingly extreme weather events caused by climate change”.
In Pennsylvania, a Patriot-News editorial said that, following the floods, “government officials at all levels need to accept the reality of climate change. Too many do not.”
Writing in his news outlet, Bloomberg, businessman and former Democratic presidential nominee Michael Bloomberg made a direct link between the “climate denialism” of the Trump administration and the disaster in Texas.
The New York Times has an opinion piece on the floods by MaryAnn Tierney, former regional administrator at the FEMA. Besides making a clear link to climate change, Tierney stated that:
“The uncomfortable truth is this: With each passing day, the federal government is becoming less prepared to face the next big disaster.”
More overtly right-leaning and Trump-supporting media outlets in the US took aim at “left-wing critics” for linking the event to climate change and Trump administration cuts.
An article in Fox News, which has broadcast discussions of flood-related conspiracy theories, criticised “liberals” for “politicising the disastrous flooding”.
An editorial in the New York Post is headlined: “Lefty responses to the Texas flooding horror are demented and depraved.” It argued that Democrats had “wrongly suggest[ed] that Team Trump slowed the disaster response”.
Diana Furchtgott-Roth, from the climate-sceptic Heritage Foundation, wrote in the UK’s Daily Telegraph that Democrats were trying to “politicise mother nature” by linking weather-service cuts to the deaths in Texas.
Meanwhile, Guardian columnist Rebecca Solnit urged caution in definitively linking the floods to any specific political issue amid “the information onslaughts of this moment”. She concluded that “both the weather and the news require vigilance.”
China Briefing handpicks and explains the most important climate and energy stories from China over the past fortnight. Subscribe for free here.
NEW QUOTAS: China has published the 2025-2026 provincial quotas for renewable energy consumption, which for the first time included sectoral targets for iron and steel, cement, polysilicon and certain types of data centres, industry news outlet BJX News reported, as well as updates to the aluminium sector targets established last year. Bloomberg said that the steel, cement and polysilicon sectors will need to use low-carbon energy to “meet between 25% and 70% of their demand” under the policy. Energy news outlet International Energy Net noted that Sichuan, Yunnan and Qinghai provinces faced the “highest quotas”, at 70%. (For comparison, the average provincial quota is 38%, Carbon Brief calculated. A separate quota for these three provinces that does not include hydropower is much closer to the national average.)
POWER RUSH: In contrast to expectations that renewable installations in China would slow for the rest of 2025, the state-run thinktank State Grid Energy Research Institute estimated that 380 gigawatts (GW) of solar, 140GW of wind power and 120GW of thermal power (likely mostly coal) will be added this year, Bloomberg reported. It noted that the solar figure is “more than 50% higher than forecasts from the leading solar industrial group”. According to NEA data, the estimate implies China will add 182GW in solar, 94GW in wind and 102GW in thermal power between June and December.
MANAGING THE INCREASE: Li Chao, spokesperson for the National Development and Reform Commission (NDRC), told reporters that “large-scale xiaona (消纳) consumption of renewable energy is critical” given rapid capacity growth, according to industry outlet China Energy News, adding that consumption rates continue to exceed 90% – meaning no more than 10% of potential output is being wasted, according to government calculations. However, separate outlet China Energy Net reported that wind and solar utilisation rates (利用率) in some provinces fell below the government-set red line of 90%, due to rapid growth. Dr Muyi Yang, senior energy analyst for Asia at thinktank Ember, told Carbon Brief: “The recent dip in utilisation rates in the western regions is an early warning that [investment in the grid] needs to speed up.”
OPEN ARMS?: Coal power still has “room to grow” during the fifteenth five-year plan period (2026-2030) despite market challenges, China Electricity Council chief expert Chen Zongfa told BJX News. Chen said this was due to the changing “attitude of the government”, which “no longer demonises coal”. The influential State-owned Assets Supervision and Administration Commission of the State Council (SASAC) pledged to “speed up the construction of thermal power projects” and “ensure the safe and stable supply of coal”, according to China Energy News. Another China Energy News article quoted an NDRC official saying China needed to “ensure the stability of coal supply”. Meanwhile, in a visit to Shanxi, President Xi Jinping told local policymakers to transform the coal industry “from low-end to high-end” while also developing clean-energy, Xinhua said.
‘INTENSE’ RAINS: Several regions in China, including the southern Henan, Guizhou and Hubei provinces, were hit by “intense rainfall” throughout late June and early July, causing “severe flooding” and several deaths, Bloomberg reported, in an article noting that climate change is “fuelling” extreme weather events. Meanwhile, high temperatures “enveloped China’s eastern seaboard…raising fears of droughts and economic losses”, Reuters said, adding that “extreme heat, which meteorologists link to climate change, has emerged as a major challenge for Chinese policymakers”.
NEW WARNINGS: At the launch of the China Blue Book on Climate Change 2025 – a document outlining global and China-specific impacts of climate change – National Climate Center deputy director Xiao Chan stated that the “national average temperature in June was 21.1C”, marking the hottest June since records began, according to business news outlet 21st Century Business Herald. State news agency Xinhua quoted Chen Min, vice-minister of the Ministry of Water Resources, telling reporters that 329 rivers had flooded “above warning levels” as of 4 July. Meanwhile, the government established a new heat-health warning system, which “aims to strengthen public health preparedness amid growing climate challenges”, the state-run newspaper China Daily said.
GRID PRESSURES: Linked to high temperatures along the east coast, the National Energy Administration (NEA) revealed that China’s maximum power demand reached a “record high” of 1,465GW on 4 July, finance news outlet Yicai reported, adding that air-conditioning load “accounted for about 37%” of the peak power grid load in eastern China. Bloomberg said that the grid is “in better shape to take on peak summer demand this year”, following preparations to avoid previous blackouts.
MIIT HAUL-UP: In a meeting with solar industry representatives, Ministry of Industry and Information Technology (MIIT) head Li Lecheng said MIIT “will further increase macro-guidance and governance of the industry” in the face of “low-price disorderly competition”, BJX News reported. The Hong Kong-based South China Morning Post (SCMP) noted that Li also said companies should be “guided” to phase out “outdated production capacity”. In its coverage, Bloomberg noted that it was “unclear” what impact the meeting would have, but that it “highlight[ed] the seriousness with which Beijing views” the issue.
CLEAR SIGNALS: The meeting followed days of signalling from China on the need to crack down on industrial overcapacity, which has been blamed for “flood[ing trading] partners’ markets with artificially low-cost goods”, according to the Financial Times. In late June, the front page of the party-affiliated newspaper People’s Daily carried an article under the byline Jin Sheping – used to signal the thoughts of party leadership on economic matters – stating that “rat race competition”, a term linked to overcapacity, would “destroy” industries such as solar, lithium-ion batteries and new-energy vehicles (NEVs). At an economic policy meeting, Xi said China must “govern low-price and disorderly competition…and promote the orderly withdrawal of outdated production capacity”, BJX News said. (He also noted the need to develop more “offshore wind power” and a “unified national market”.) On the same day, ideological journal Qiushi also published an article criticising “rat race competition”. Meanwhile, the Associated Press reported, China also “shows signs of tackling” similar overcapacity issues in the NEV industry.
EUROPE UNHAPPY: European policymakers appear unconvinced, however, with top EU diplomat Kaja Kallas telling her Chinese counterpart Wang Yi that China must “put an end to its distortive practices…which pose significant risks to European companies and endanger the reliability of global supply chains”, according to Reuters. It added that the remarks came during meetings aiming to “lay the groundwork for a summit between EU and Chinese leaders” set to take place on 24 July. Meanwhile, the EU is refusing to consider publishing a joint EU-China climate declaration at the leaders’ summit “unless China pledged greater efforts to cut its greenhouse gas emissions”, the Financial Times reported.
MITIGATION FUND: The heads of the BRICS nations, a grouping of China and several other global south countries, “demand[ed] that wealthy nations fund mitigation of greenhouse gas emissions in poorer nations” at a leaders summit in early July, Reuters said. It added that, while Brazil “urged a global transition away from fossil fuels”, the resulting joint statement “argued that petroleum will continue to play an important role in the global energy mix, particularly in developing economies”. Reacting to the summit, the campaign group WWF said in a press release: “When it comes to climate, the message falls short.”
GLOBAL SOUTH VOICE: The Guardian noted that “Brazilian diplomats see the BRICS alliance as part of an emerging new world order”, noting that the summit featured “pushback against the EU” over “discriminatory protectionist measures under the pretext of environmental concerns”. Brazil also used the summit to ask “China and BRICS member states in the Middle East to be among the seed funders” for long-term financing for conservation, the newspaper said, adding that this did not seem to have been successful. The absence of Xi from the meeting, in a first at a BRICS leaders summit, sparked significant speculation around how valuable China saw the block as being.
China’s Ministry of Ecology and the Environment (MEE) recently published a report outlining China’s progress last year in adapting to climate change. In this issue, Carbon Brief outlines three key messages from the assessment.
China’s climate was “relatively poor” (偏差) in 2024, the MEE report stated, with several “record-breaking or severely disastrous” extreme weather events.
These include extreme heat and cold, rainfall, typhoons, flooding and severe convective weather.
Weather events have generally worsened year-on-year, the report said. In 2024, China’s average temperature stood at 10.9C – the warmest since modern records began.
Similarly, national average rainfall totalled almost 698 millimetres, up 9% year-on-year. More typhoons made landfall in China in 2024 compared to 2023, of which several had “large disaster impacts”, according to the report.
It added that these events had “serious adverse” socio-economic impacts, noting that extreme weather led to at least 500 deaths or disappearances in 2024. (Statistics for deaths and disappearances were not included in the 2023 edition of the report.)
In 2024, the central government spent more than 2.5bn yuan ($350m) on “natural disaster relief funds”, covering flooding, drought and extreme cold.
Extreme weather is also increasingly damaging infrastructure, the report noted. For example, more than 29m users lost power due to extreme weather.
Much of the report is dedicated to describing China’s efforts to develop infrastructure that can resist or help mitigate the effects of extreme weather events.
Managing “water resources” and water conservation continued to receive a strong focus in the report, which added that, in 2024, “major water conservancy projects continued to be developed to a high quality”.
It also noted that this infrastructure buildout “played a key role” in mitigating the impact of floods in 2024, with thousands of reservoirs nationwide being used to store floodwater.
This, it said, “reduced” the impact of 26 floods on 2,300 cities and towns and 17m mu [slightly more than 1m hectares] of arable land”.
The country is also strengthening its ability to predict future extreme weather events, building more than 10,000 new monitoring and early-warning stations in 2024.
Cities are being encouraged to become more “climate resilient”, with 39 authorised to develop pilot programmes exploring possible solutions.
The report noted that, in 2024, 60 cities were developing “sponge city” projects, using nature-based solutions to absorb, collect or reuse floodwater.
Liu Junyan, project lead for the climate risk project at campaign group Greenpeace East Asia, told Carbon Brief that sponge-city solutions did seem to play a beneficial role during the deadly Henan floods in 2021, where floodwaters receded more quickly in Zhengzhou city than other areas.
“But sponge-city methods are not made to handle the extreme rainfall caused by climate change,” she added.
The MEE report emphasised that China’s overarching climate adaptation strategy covers a broad range of socio-economic impacts.
For example, it mentioned efforts in 2024 to prepare technical guidelines for assessing climate change impacts and risks. Carbon Brief understands that the aim of these efforts is to help provincial governments use more standardised, science-based assessments of climate risk, as well as how they should respond.
The report also noted efforts to develop climate-conscious behaviours, such as campaigns encouraging farmers to use “water-saving” irrigation technologies and guidelines to “enhance public awareness” of potential climate-related health risks.
Liu said China’s approach to adaptation is “holistic”, but added that it remains “top-down”, sometimes causing local needs to go unmet.
Furthermore, the report said China needs to further develop strategies for climate impacts on “urban and rural habitats” and “sensitive” industries such as finance, tourism and energy.
HAWKS AND DOVES: The European Parliament broadcasted a debate on EU-China relations ahead of the upcoming leaders’ summit, in which European Commission president Ursula von der Leyen spoke on electric vehicles, rare earths and overcapacity.
DEFINING MOMENT: Shanghai-based news outlet the Paper interviewed former UN secretary-general Ban Ki-moon on China’s role in accelerating climate ambition this year.
CLIMATE PATH: Analysts at the Asia Society Policy Institute’s China climate hub spoke on Environment China about China’s latest emissions, clean-energy and climate diplomacy trends.
STUNTING GROWTH: The US-based National Public Radio explored how climate change is affecting China’s tea-growers, with crops “stunted” and farmers struggling with “changing rhythms”.
The electrification rate of China’s transport sector – well below the economy-wide figure of close to 30% – despite the rapid adoption of NEVs, Chen Ji, executive director at China International Capital Corporation, said at the China launch of the International Energy Agency’s World Energy Investment 2025 report, attended by Carbon Brief. Chen added that the low figure was due to the lack of progress in electrifying aviation and heavy-duty trucks.
Increased socioeconomic impacts with future intensifying flash droughts in China
Geophysical Research Letters
A new paper found that “China will experience longer and more severe droughts, exposing 33% of the population and 35% of gross domestic product to risks under a medium-emission scenario”. The authors analysed economic and soil moisture data over 2000-22 to quantify past changes in “flash droughts”, using models to assess future changes under different climate scenarios. The paper found that “droughts are becoming more frequent in some areas, with a twofold increase in frequency in approximately 32% of these areas by the century’s end”. It added that wealthier regions will face greater economic losses due to flash droughts.
Communications Earth & Environment
Rice cultivation in China’s Sanjiang Plain has expanded northeast by more than two million hectares between 2000 and 2020, driving up irrigation demand by 6bn tonnes, according to a new study. The authors analysed data on “rice migration”, finding that rice expansion drove up irrigation by 122% over 2000-20, while an increase in rainfall due to climate change reduced irrigation demand by 22%. The authors said their findings “highlight the urgent need to make integrated strategies balancing crop migration [with] climate change and water resource conservation”.
Climate Change Research
The poorest counties in China are much more likely to experience record-breaking extreme weather events, which may push them “back to poverty”, according to new research published in a Chinese academic journal. The study combines more than twenty models with eight extreme weather indices to assess “patterns of extreme weather across 832 poverty-alleviated counties [as well as] other counties in China”. The authors recommend actions covering “water infrastructure; disaster mitigation; catastrophe insurance; and public awareness and education” to support climate adaptation in these areas.
China Briefing is compiled by Wanyuan Song and Anika Patel. It is edited by Wanyuan Song and Dr Simon Evans. Please send tips and feedback to china@carbonbrief.org
The conference saw experts discussing the dangers of a range of Earth system tipping points, including the dieback of the Amazon, the melting of the Greenland ice sheet and the shutdown of the Atlantic Meridional Overturning Circulation (AMOC).
Attendees also explored “positive tipping points” – large-scale, self-propelling social changes that would reduce the impact of humans on the climate.
(For more on the key talking points, new research and ideas that emerged from the four-day event, see Carbon Brief’s full write-up of the event.)
On the sidelines of the conference, Carbon Brief asked a wide range of delegates which tipping point concerns them the most.
These are their responses, first as sample quotes, then, below, in full:
I am worried about all of them, but for the immediate future, I am particularly worried about tipping points that involve the biosphere and humans due to breaching thresholds for heat or drought that then ripple into food availability, livelihood and ecosystems. The Earth system tipping points will do that too, but maybe a little bit later. Examples [of this] are the coral diebacks triggered by marine heatwaves, forest change and fires, and droughts threatening livelihoods and putting people on the move.
I did a research project on the US Dust Bowl and the trigger [for that event] was drought causing vegetation and crop dieback, [which led to] extreme heat and dust storms in response – and migration, as memorialised in [the 1939 John Steinbeck novel] The Grapes of Wrath. And, now with warming, all droughts get supercharged.
Image - Prof Carlos Nobre (note)Prof Carlos NobreThe Amazon is a very serious tipping point, because [dieback] could release around 250bn tonnes of CO2 by 2100 – which will make it impossible to [limit global warming] at 1.5C. We could also lose the largest [host to] biodiversity on the planet, which would induce a tremendous, large number of epidemics and several pandemics. Also, of course, the Amazon forest controls aspects of the global climate. In South America, the climate is entirely controlled by the Amazon forest.
I’m most worried about Amazon [dieback] because I have worked on it for 40 years. But the other tipping points deeply concern me. The melting of the permafrost will release more than 200bn tonnes [of greenhouse gases], mostly methane. Ice sheet melt in Greenland is a very serious tipping point because it could raise sea level rise by three metres in 200 years. The melting of Greenland has already started. Species extinction is also very serious.
One thing that was not much talked about [at this conference] is that when the ocean heats up, particularly the Arctic Ocean, then a tremendous amount of methane is released. And if that happens – if the Arctic Ocean warms up by 3-4C – the amount of methane that would be released could see [air] temperatures reach 8-10C [above pre-industrial levels]. At 8-10C, the only inhabitable places for us humans will be the top of the Alps, the Andes and the north and south poles. The rest of the planet would be uninhabitable.
Image - Gaia Vince (note)Gaia VinceI would say that we have already passed the tipping point for coral reef ecosystems, for example. That really is a tragedy. As a scuba diver, I find it a tragedy because I love coral reef ecosystems, but it’s also a tragedy for human systems. They are the nursery for our fisheries. And, of course, they’re not just fisheries – they are a valid ecosystem and a biodiversity hotspot. This will have untold consequences and cascading impacts for other parts of the ecosystem, for example, the cycling of nutrients and coral reefs are really important to stop coastal erosion. And they actually provide sand, the lovely white sand that people go on holiday for.
Image - Dr Andrew Hartley (note)Dr Andrew HartleyThe tipping point I’m most concerned about is Amazon forest dieback and reduction in the function of the Amazon forest, because of the significance of the carbon cycle and the feedback to the global climate. Also [due to] the effects that Amazon tipping has on food security, both locally and globally, because of [the Amazon’s] contribution to major commodity markets, such as soybean and maize.
This might interact with climate change in the future to lead to more severe events, particularly in populated areas of Brazil. If an Amazon tipping point were to occur, it might lead to more severe events on the coast of Brazil which would affect a much larger population. There are negative impacts across the forest from the drying of the forest, for example for the Indigenous communities, but also globally.
Image - Prof Tim Lenton (note)Prof Tim LentonThe Atlantic Meridional Overtoning Circulation, or AMOC, for sure. The consequences of crashing that would be devastating globally – and also for where I live in the UK. By our own calculation, we could have less than half the viable area for growing a couple of major staple crops, wheat and maize worldwide. We would have a widespread water crisis. We could have collapses of the monsoons in West Africa and India that would displace hundreds of millions of people. It is hard to see that as anything other than a catastrophe.
Image - Prof Peter Cox (note)Prof Peter CoxThe one that I have worked on most and worries me most at the moment is Amazon dieback. And that’s because we’ve got two things, two stressors going on at once that push it in the wrong direction. Climate change is one, deforestation is another. You can imagine crossing the boundary in various ways – but, if you push diagonally, you get there quicker.
If I had spoken to you 25 years ago, I would have said I’m really worried about [Amazon dieback]. Then I went through a phase of thinking that the models have overdone it. And now I’m thinking the models that don’t include land-use change are underdoing it. So, I’m more concerned about that one.
There are others as well, but that is the one that is also quite fast. The other [tipping points] we worry about, we’re worried about a long-term commitment. It takes a while for the AMOC to shut down, it really does. It takes a while for the Greenland ice sheet to melt. We’ve done work that suggests you can overshoot even a little bit for these slow systems. The Amazon forest is a decadal dieback, especially if it is fire driven.
Image - Prof Johan Rockström (note)Prof Johan RockströmThere is not a simple answer to this – there is a two-part answer.
The tipping element that worries me most is coral reef systems, for the simple reason that the scientific uncertainty range is very limited. We have, unfortunately, ample evidence that at 1.5C we’re very likely to knock over, potentially, the entire tropical coral reef system on Earth. [This threatens] the livelihoods of 400 million people and a fundamental nursing ground for the whole ocean food web. So that is one deep concern. It is the canary in the coal mine – the first kid on the block to fall over. We’re so close.
The second one is AMOC – the whole overturning of heat in the Atlantic, which connects the entire ocean system. Not only is the latest science showing that we are going from low likelihood to uncomfortably high likelihood, but we also know – with very little uncertainty – that this would cause a catastrophic impact across the entire world, and it would go fast. So the AMOC, I would argue, is today the most important scientific message to the world. If you want a really hard-hitting reason to act at a level of planetary emergency, it is the AMOC. That is the second one.
From a planetary boundary perspective, it is important to recognise that – on climate science grounds – the Amazon basin is not at risk of tipping until 3-5C of warming. But as soon as you factor in loss of biodiversity, deforestation and changes in hydrology – then the temperature risk goes down to between 1.5-2C. So suddenly – when taking a more integrated [assessment] approach – the conclusion is that it is also very close to a tipping point.
Image - Dr Patricia Pinho (note)Dr Patricia PinhoFor me, it is the Amazon. When we think of the planetary crisis, we think about the Amazon and all the regulating climate services it provides. This is not only regionally, but we know it’s a global “climate good”, if you will. But it is highly sensitive to land-use change and increasing temperature. So, if we transition to a point of no return – Amazon dieback – and transforming or transitioning to another ecosystem, the function of the forest will not be doing what it has been doing for the past millennium and so on. And then we cannot revert this loss. I think it is going to be a really profound, irreversible change that will affect the global population in the most dramatic way.
Of course, we have the people on the front line that I’m working with – Indigenous people, traditional population – that are safeguarding this resource, but they are also at the front line of climate risks and the impacts that we already observe. If we miss this opportunity of really reverting from increasing greenhouse emissions and increasing temperature, we’re going to miss the window of opportunity to really protect the region, protect the ecosystem and the forest for the global society.
Image - Prof Ricarda Winkelmann (note)Prof Ricarda WinkelmannSo I am thinking about this from a risk perspective – so both the likelihood as well as the impacts – and I think the answer depends on that. Because when it comes to the likelihood and the particular threshold – and we know about those – I’m mostly concerned about the Greenland and the West Antarctic ice sheets. This is because we know that, even at lower warming levels, they’re already at risk of transgressing tipping points in certain regions.
But when it comes to the impacts and also the timescales over which those play out, there are other tipping elements that worry me most. In particular, regional tipping elements. So if we think of the mountain glaciers, for instance, these impacts are already experienced right now and several mountain glaciers are undergoing these accelerated changes. And so thinking about the timescales when it comes to the impacts is also incredibly important.
Image - Dr Nico Wunderling (note)Dr Nico WunderlingThe tipping element that worries me most is the Amazon rainforest. This is because the Amazon rainforest is not only threatened by climate change, but also by deforestation at the same time. So that means that the critical threshold from climate change alone, at around 3-4C of global warming, can come down to 1.5-2C. Climate change and deforestation basically go hand-in-hand to lower the [Amazon’s tipping] threshold because of this double threat.
Image - Dr Rebecca Shaw (note)Dr Rebecca ShawThe coral reef tipping point – it comes first because of warming surface waters, and then the outcome is sealed by ocean acidification. It signals the end of the most colourful and biodiverse ecosystem which supports the nutrition and livelihoods of over one billion people and has captured the imagination of more people than any other through the characters like Nemo the clownfish, SpongeBob SquarePants, and, of course, Frank the coral [a character from an educational YouTube video].
If humanity is not motivated to act in the face of the loss of coral reefs, is there hope that we will act in time to prevent the Amazon and glacier tipping points?
Image - Dr David Obura (note)Dr David OburaThe ice [tipping elements] – because they are the first ones to go that have cascading impacts on other tipping elements. When [ice masses] reduce, we lose their albedo, waters heat up more [and] the AMOC can collapse. That has the biggest impact across the planetary system, including the Amazon.
My own [research], of course, is coral reefs. So, in a way, the coral reef tipping point does concern me the most. [But] it doesn’t have cascading impacts on other tipping elements. It does on people, in socioeconomic terms – but not on other system elements. So, in a sense, it is the least worrying one.
Image - Dr David Armstrong McKay (note)Dr David Armstrong McKayOne of the tipping systems that concerns me the most is Amazon rainforest dieback. Because even though we assessed it a few years ago as having a warming threshold that’s a bit higher than what we might be seeing – we’ve thought it is maybe at a best estimate of 3.5C – there’s also deforestation as well. The Amazon is actually probably closer to a deforestation-induced tipping point than to a climate change-induced tipping point. So I actually think that could be potentially in the offing sooner than we would like. That would have huge impacts for biodiversity, for South America as a whole, by shifting rainfall patterns, which would really affect a lot of people for agriculture or ecosystems. Also, the Amazon as an ecosystem is so incredibly biodiverse and amazing in itself, it would be a tragedy to lose it.
Image - Kate Raworth (note)Kate RaworthThe tipping point that I fear we will fail to cross is [the social tipping point] around transforming our mindsets. We need to move from the extractive, degenerative economy towards a regenerative one. This all starts within our head and it underlies everything.
[A failure to do this] is what is driving us towards all these [Earth system tipping points].
]]>These are two key conclusions from the latest report on risks to the government finances from the independent Office for Budget Responsibility (OBR), which includes a chapter on climate change.
The new OBR report shows very clearly that the cost of cutting emissions to net-zero is significantly smaller than the economic damages of failing to act.
Here are four key charts from the OBR report.
The UK could take an 8% hit to its economy by the early 2070s, if the world warms by 3C this century, according to the new OBR report.
(This aspect of the OBR report has been picked up in a Reuters headline: “Global 3C warming would hurt UK economy much more than previously predicted, OBR says.”)
Its latest estimate (blue line) of the impact of “climate-related damages” by the 2070s is three percentage points (60%) higher than thought just last year (yellow), as shown in the figure below.
The OBR says that the increase in its estimate of climate damages is due to using a “more comprehensive and up-to-date analysis”.
(The world is currently on track to warm by only slightly less than 3C this century.)
The impact of climate damages on government borrowing would be nearly twice as high by the 2070s, if global warming goes unchecked and reaches 3C, according to the OBR report.
This is shown in the figure below, which compares additional government borrowing each year, as a share of GDP, if warming is limited to less than 2C this century (left) or if it climbs to 3C (right).
The OBR explains that the largest impact of climate damages on government borrowing is “lower productivity and employment and, therefore, lower tax receipts”.
When it comes to cutting UK emissions, the OBR says the government will only need to invest just over half as much on reaching net-zero, compared with what it expected four years earlier.
This is shown in the figure below, with the latest 2025 estimate (right) showing a cumulative government investment of 6% of GDP across the 25 years to 2050, down from 11% (left).
(Note that the large majority of “lost government receipts”, shown in yellow in the figure below, are due to fuel duty evaporating as drivers shift to electric vehicles. As the OBR notes, the government could choose to recoup these losses via other types of motoring taxes.)
The OBR takes its estimates of the costs and benefits of cutting emissions to net-zero from the government’s Climate Change Committee (CCC). The CCC recently issued significantly lower estimates for net-zero investment costs, due to more rapidly falling clean-technology costs.
Acknowledging this shift, the OBR says the latest CCC estimates on the cost of reaching net-zero are “significantly lower” than earlier figures.
It notes that the net cost to the economy of reaching net-zero emissions by 2050 is now put at £116bn over 25 years, some £204bn lower than previously expected.
In very rough terms, this figure – which excludes health co-benefits due to cutting emissions and avoided climate damages – is equivalent to less than £70 per person per year.
Taken together, the OBR findings show more clearly than ever before that the cost of taking action to tackle climate change would be far lower than the cost of unchecked warming.
For the first time, its latest report combines the estimated cost of cutting emissions with the expected damages due to rising temperatures in a single figure, shown below.
The comparison illustrates that climate damages (blue bars in the chart) are set to impose severe costs on the UK public finances, even if warming is limited to less than 2C this century (left).
The OBR also shows how the cost of government investment in cutting emissions (yellow) is both temporary and relatively small in comparison to climate damages.
Moreover, it highlights how unchecked warming of 3C this century (right) would impose far higher climate damages on the UK government’s finances than if global temperatures are kept in check.
Specifically, global action to limit warming to 2C instead of 3C could prevent more than 1 percentage point of climate damages being added to annual government borrowing by the 2070s.
In contrast, the combined estimated cost to government of action to cut emissions never exceeds 0.6 percentage points – even if lost receipts due to fuel duty are not replaced (green).
Beyond these new numbers, the OBR acknowledges that it still does not include the cost of adapting to climate change, or the impact this could have on reducing damages.
Nor does it consider the potential for accelerated transitions towards clean energy, technological advances that make this shift cheaper or the risk of tipping points, which could cause “large and irreversible changes” to the global climate.
The event was billed as a “call to action” to the “research community, policymakers and business to raise awareness and understanding of the importance of tipping points and to accelerate the required action”.
As human activity drives global temperatures to record highs, multiple parts of the Earth system are at risk of being pushed beyond thresholds that would see them shift irreversibly into a new state.
The conference also focused heavily on “positive tipping points”, where large-scale, self-propelling social change can reduce the impact of humans on the climate.
Hosted jointly by the Global Systems Institute at the University of Exeter, the Potsdam Institute for Climate Impact Research and the Max Planck Institute of Geoanthropology, the conference was the second event dedicated to global tipping points, following the first in 2022.
A statement issued by conference convenors – and endorsed by hundreds of delegates – warned that the window for preventing tipping points is “rapidly closing”.
It called for “immediate, unprecedented action from policymakers worldwide and especially from leaders” at the forthcoming COP30 climate talks in Brazil.
The meeting was part of a week-long Exeter Climate Forum, which also included a separate Climate Conference and a series of community and business-focused events.
In this article, Carbon Brief draws together some of the key talking points, new research and ideas that emerged from the four-day event.
In a separate article, a wide range of delegates respond to the question of which tipping point concerns them most.
As he opened the conference, Prof Tim Lenton – director of the University of Exeter’s Global Systems Institute and one of three convenors of the event – introduced tipping points and set out the direction of the upcoming four days of talks.
He explained that tipping points are caused by “amplifying feedbacks” in a system becoming “self propelling”. He said these systems are “very hard to reverse and it could be quite abrupt”.
Lenton warned that since the last tipping points conference in 2022, global temperatures have risen, bringing many Earth system tipping points closer.
However, he told the conference that not all tipping points are harmful, distinguishing between a “bad tipping point in the climate or a positive one in societies and technologies”.
Lenton told the conference that “there is a compelling case that we could accelerate out of trouble”, adding that we could “lift [many people] out of harm” by focusing on positive tipping points.
Prof Johan Rockström, director of the Potsdam Institute for Climate Impact Research (PIK) and joint convenor of the conference, talked about the importance of considering planetary boundaries in tipping-points research. This framework sets out nine interlinked thresholds that would ensure a “safe operating space for humanity”.
Rockström told the conference that using this “whole Earth approach” can highlight that thresholds for tipping points may be lower than when only considering climate change.
For example, he said the Amazon rainforest is at risk of crossing a tipping point that could trigger “dieback” at around 3-5C of global warming above pre-industrial levels. However, he said that “transgressing” other thresholds, such as deforestation and moisture levels, could cause the system to tip sooner.
Rockström also argued that Earth system risks have now reached the “global catastrophic” level – defined by the Global Challenges Foundation as an event or process that “would kill or seriously harm more than 10% of the human population”.
He said the collapse of the Greenland and West Antarctic ice sheets, the dieback of the Amazon rainforest and the shutdown of the Atlantic Meridional Overturning Circulation (AMOC) present the greatest risk, as they have a high severity of impact and probability of occurrence.
He closed by arguing that scientists need to better communicate the risks of tipping points to encourage more action.
Prof Ricarda Winkelmann, the third convenor of the conference and professor of climate system analysis at PIK, discussed tipping of the Greenland and West Antarctic ice sheets, which together hold enough ice to raise global sea levels by 65 metres.
Winkelmann encouraged the delegates to consider timescales. She described tipping of the ice sheets as “slow-onset systems”, but highlighted that they can also “undergo quick and abrupt changes”.
To demonstrate this, she played a video of “calving” from the Ilulissat glacier in western Greenland. This was the largest calving ever caught on camera, which saw chunks of ice up to 1,000-metres thick break off the main ice sheet, she said.
Winkelmann described a “time clash” between the long-term changes in biophysical systems and short-term changes in socioeconomic systems. She concluded:
“The choices and actions implemented in this decade really have impacts now and also for the next 1,000 years.”
Also in the opening plenary session, Dr Carlos Nobre, a former Earth system scientist at the University of São Paulo, discussed tipping in the Amazon rainforest.
He said that decades of “high-level deforestation and degradation” across the Amazon have resulted in “much less water recycling”, as well as droughts and forest fires, that are creating a “tremendous health problem” for people.
Nobre noted that higher levels of deforestation push down the temperature threshold at which the rainforest could tip from lush rainforest to dry savannah.
He also discussed “nature-based solutions” and the importance of combining scientific knowledge with Indigenous knowledge and local communities.
Dr David Obura, the founding director of CORDIO East Africa and chair of the Intergovernmental Science-Policy Platform on Biodiversity and Ecosystem Services (IPBES), highlighted the importance of the IPBES framing, which emphasises the need to connect nature and people.
He flagged the state of the world’s coral reefs, telling delegates that, as of the end of last year, 44% of the 800 coral reef species studied by the International Union for Conservation of Nature (IUCN) are “threatened”.
Obura added that “ocean temperatures have shot up in the last few years”. However, he warned that looking at temperature alone is insufficient, arguing that there are other physical and socioeconomic factors that need to be understood.
In the panel discussion that followed, Nobre stressed the importance of the COP30 talks in Brazil this year “looking at solutions” to the changing climate. Obura said that humanity has “extracted wealth from nature into economic systems”, arguing that this money must “come back into nature”.
When asked why the risk of tipping points is not being discussed at the UN security council, Rockström flagged an “inability to handle timescales” and said that language around uncertainty allows politicians to “kick the can down the road”.
When asked about the media, Rockström said it is “unfortunate” that humanity is allowing a media landscape that “underplays risk” and allows only “soundbites” from scientists. He added that the “media has a huge responsibility” in the current framing of climate change.
However, Winkelmann said the media “can play an incredibly important role in moving things forward”.
While the central themes of the 2022 conference were the two main areas of climate tipping points and positive tipping points, the 2025 event took a broader focus that encompassed social systems and governance.
Prof Winkelmann told Carbon Brief that this reflected how the tipping points “community” is much larger now than it was three years ago:
“The community has grown a lot since [2022] and it especially also includes not just the scientific community, both on the biophysical side and the social side, but also a lot of people from policy, governance and business. So I think it is really brilliant to have this community here together, thinking about tipping dynamics and the impacts in this holistic approach.”
Lenton told Carbon Brief the conference was “bigger and more diverse” than the 2022 edition. This, he said, was likely due to “demand for knowledge of the subject”, alongside a wider range of “stakeholders, voices and actors” being engaged in discussions about tipping points.
While tipping points are well-defined in natural sciences, they are less so in the social sciences, Rockström told Carbon Brief:
“I would even argue that many social scientists – even some social scientists at this conference – are even uncomfortable in using the term social tipping point, or positive tipping point, and are much more academically grounded in defining ‘social transformations’, ‘social transitions’ or ‘social change’. I have a strong respect for that. It is really important to humbly recognise that the social sciences come at this with very different methods and theories.”
In a plenary session on social-ecological tipping points, Dr Patricia Pinho – deputy science director at the Amazon Environmental Research Institute (IPAM) – argued that “we can’t really model forest resilience if we ignore the people that are on the frontline”.
According to her presentation, “Indigenous and traditional communities are already experiencing and resisting socio-ecological tipping points”.
Global warming and land-use change have led to forest degradation in 36% of the region, Pinho said. Combined with increasing forest fires, heat and drought, communities are seeing impacts on “food security, health [and] loss of biodiversity”, she added:
“So what we are seeing is loss of identity, place, attachment. People are losing their relationship [with the Amazon] and livelihoods and culture.”
Another plenary considered the positive tipping points in “socio-technical systems”.
Among the talks, Simon Sharpe, former deputy director of the UK government’s COP26 unit and now managing director of the non-profit research group S-Curve Economics, outlined the progress towards positive tipping points in the sectors of power generation, road transport and steel production.
While the power-sector transition is “going quite well” and light road transport is already seeing electric vehicles (EVs) make up “20% of new car sales globally”, the steel transition is in its “very early stages”, Sharpe explained.
For the steel industry, the “tipping point that we have to cross is in terms of risk perception”, Sharpe said:
“You have to get to the point where industry feels that actually it’s no longer the ‘first-mover risk’ that is the biggest risk – it’s the ‘late-mover risk’ that’s the biggest risk.”
Sharpe argued that this was best achieved by a clean-steel subsidy, noting that “we’ve seen for the brief period where the US had its [Inflation Reduction Act] and was strongly subsidising clean industrial production”. He continued:
“That resulted in a big shift of industry lobbying in Japan and the EU, where all the steel companies suddenly said, ‘Oh, can we have clean-steel subsidies as well, please?’”
Focusing specifically on EVs, Dr Jean-Francois Mercure from the University of Exeter described his forthcoming study on the tipping point “that is unfolding now”.
This has been driven by a feedback loop between the falling cost of EVs and the rise in how many are being purchased, Mercure explained:
“The cost coming down helps people buy more electric vehicles; more electric vehicles [being bought] causes the cost to come down.”
While there is “exponential growth” in EV sales, Mercure showed how the sales market share in conventional cars has been “plunging” in “Germany, UK, France and especially China” since 2019:
“So we’re kind of saying, yes, the system has started to tip into this new electric vehicle regime.”
However, Mercure added, “it’s fragile” as it could be bogged down by policy reversals. He also noted that there are barriers, such as China’s dominance in producing batteries, which is “becoming problematic” and led to tariffs in the EU and US.
From the audience, Prof Joyeeta Gupta of the University of Amsterdam questioned whether EVs are seeing a “long-term” tipping point when the global south is considered:
“Electric cars are going up the global north, but the old petrol cars are going south. Basically, what you’re seeing is that when certain things improve in the global north, the older stuff just gets dumped on the global south.”
The conference also emphasised the importance of governance, with multiple breakout sessions and a plenary dedicated to the topic.
In one breakout session, author Herb Simmens explained that governance is a “system of rules, processes and practices by which public institutions are managed and controlled”, which aim to “establish how decisions are to be made, and then to ensure that those responsible for making them do so”.
He argued that setting out to limit tipping points should be considered policymaking, not governance. However, he said that strong global governance is needed in order to oversee the implementation of policies to stop global warming. He also added that local governance is needed in many instances – for example, to stop deforestation in the Amazon in order to prevent the rainforest from tipping.
Dr Manjana Milkoreit – a postdoctoral researcher at the University of Oslo – chaired a plenary session on governance. She told delegates that the 2023 tipping points report identifies “two major domains of governance involved” in managing global tipping points. These are “prevention” and “reorganisation”, she said.
Sandrine Dixson-Decleve, co-president of the not-for-profit Club of Rome, stressed the importance of discussing how to “integrate planetary emergency at the top level into constitutional law”. She concluded:
“If we can’t get the governance to work right now, we have to think about other types of governance frameworks at the local level, community level, that start to create the feedback loop all the way back up to the international level.”
Durwood Zaelke, founder and president of the Institute for Governance & Sustainable Development, highlighted the success of the Montreal Protocol – an agreement signed in 1987 by nearly 200 countries to limit emissions of “ozone-depleting substances” in an effort to stem the damage to the ozone layer.
He argued that governance on cutting emissions must be binding, as the Montreal Protocol was, rather than voluntary.
He also argued that cutting CO2 emissions is “essential, but a slow process” and advocated for more emphasis on cutting emissions of “short-lived super-pollutants”.
Prof Per Olsson, deputy science director at the Stockholm Resilience Centre, said there has been a “deeply problematic” backlash in the past five years, in the form of “political polarisation”, “war”, “democratic backsliding” and the “dehumanisation of people that think differently from you”. He warned that these “threaten to derail many processes”.
Oliver Morton is a senior editor at the Economist and serves on the board of trustees of the Degrees Initiative – a non-government organisation that focuses on promoting expertise on solar radiation management in the global south. (However, he said at the start of his talk that he was not speaking in these capacities.)
Morton argued for a greater emphasis on solar geoengineering in the tipping points community.
Morton told delegates that the lengthy 2023 global tipping points report featured only a few paragraphs on solar geoengineering, stating that the technology “might” help limit temperature rise, he said:
“I would really be interested in that ‘might’. But that’s not, in fact, what this community does. It’s not what people particularly seem to want to talk about.”
Morton noted that many delegates of the recent Arctic Repair Conference, which was held in Cambridge in June, were present at the tipping points conference, highlighting the “overlap” between the two fields.
He recognised the challenges with the governance of solar geoengineering, but added that there are challenges “for all governance”. He also emphasised that “everyone in the solar geoengineering community” says that the technology would “complement, not replace, mitigation”.
Morton emphasised the need for expertise on solar geoengineering in the global south. He concluded that “sidelining” research on geoengineering, which potentially could reduce harm, opens up the tipping-points community to criticism for not considering all options. He referred to this as “choice-editing”.
Finally, Prof Joyeeta Gupta, spoke about the divide between the global north and global south.
She said that she is working to introduce a global constitution “to try to understand how to regulate the public and private sector” and she invited the audience to participate by sending in submissions.
When asked whether the phrase “tipping points” has been watered down, Sandrine said that words like “regenerative” and “sustainable development” are overused and agreed that we “can’t keep playing with the language until it becomes nonsensical”. She called on conference delegates to come together to define key terms.
At a breakout session, Prof Karen Morrow, a professor of environmental law at Swansea University, explained that the legal system currently does not deal well with any issue at the planetary scale, as global problems cannot be reduced to a “nice, tidy jurisdictional issue”.
She said that the irreversibility of Earth system tipping points is “horriffic”. However, she noted that the language of uncertainty in science can make it hard to “find a foothold” legally, arguing that the irreversibility may help with this by providing more certainty.
She added that there are currently laws around “obligation to prevent harm”, but said that there are “not enough”, arguing that we need laws that dictate a “substantive restraint on human activities”.
A significant portion of the conference was dedicated to “positive tipping points” – described to Carbon Brief by Rockström as “social transformations” that generate “feedbacks that are self-enforcing”, making them difficult to reverse.
Examples of these social transformations that featured in plenaries and research sessions included the rapid rollout of EVs in Norway, tree-planting schemes in Uganda, investments in “regenerative” cotton farming and the falling costs and rising adoption of solar energy around the world.
In a breakout session, Dr Jean-Francois Mercure said the “positive tipping point narrative is good because it changes the policy narrative”. He explained:
“We used to have this narrative, which goes – ‘we tax [and] we price the externality because prices need to reflect costs’. This is demanding because it is politically difficult to tax and subsidies need to be justified. [That narrative says] we are pushing a thing that gets harder the more we do it – so there is a limit to climate action.
“This is not how it really works. When you look at the solar revolution, we had to push up to a certain point, after which it went off on its own. Electric vehicles, too. This [narrative] changes what policymakers need to do and think. They need to work to push over the initial hurdle.”
In a plenary session, Kate Raworth, an ecological economist at the University of Oxford, highlighted how a growing number of states, cities and regions around the world had adopted her “doughnut” theory of economics.
“Doughnut economics” is a framework which imagines a global economy which prioritises meeting the needs of people without overshooting planetary boundaries.
Raworth highlighted how more than 50 municipal governments had publicly adopted the framework since 2019 – and added there are “another 50 doing it behind the scenes”. She said that “peer-to-peer inspiration” has been a powerful force in driving momentum behind the framework’s popularity.
Prof Jemilah Mahmood, executive director of the Sunway Centre for Planetary Health at Sunway University in Kuala Lumpur, described how her organisation’s advocacy had led to the Malaysian government’s adoption of a planetary health framework in its forthcoming economic development plan. She also said planetary health would become a mandatory part of the nation’s undergraduate curriculum from 2026.
Túlio Andrare, chief strategy and alignment officer for the COP30 presidency, described the Brazilian government’s plans to convene a “global mutirão”, which encourages individuals, communities and organisations to make self-determined commitments to take actions to tackle climate change. (Mutirão is a word from the Indigenous Tupi-Guarani language family that refers to collective action). He said:
“The global mutirão is about inviting people to think about who they are and what they can offer. It is also about designing potential positive tipping points. Because if we have different initiatives that are self-organised, we can integrate those local initiatives in a global framework.”
In a separate plenary session on tipping points within food systems, Rune Baastrup, director of development at Democracy X, a private foundation focused on deliberate democracy, presented on a project to shift eating habits in Denmark.
The project, which he said is grounded in “sociological literature”, is to encourage a push towards plant-based eating from a local level, by funding and coordinating communal meals that citizens arrange for and with each other. Baastrup explained:
“It’s not about politicians going out pointing fingers at citizens. It is about citizens engaging and then mobilising each other – not necessarily because they want to save the world, but because they want to do interesting and cool things with their neighbours.”
According to Democracy X’s theory of change, reaching “one in 10 Danes” through this work would be enough to galvanise a “profoundly more deep green transition” in the Scandinavian country, Baastrup said.
In the same session, journalist and author George Monbiot said it was “questionable” whether the global food system could achieve a “positive tipping point”.
However, he said there were a number of actions that could be taken to create a food system which maintains high yields, reduces environmental impacts while remaining diversified and leaving space for nature restoration and recovery. He argued that these included: switching away from an animal-based diet to a plant-based diet; the embrace of perennial grain and arable crops; and production of food outside the farming system, including through precision fermentation.
Monbiot said the conversation around food systems was “going backwards”, pointing to the growing popularity of “simple living, grow-your-own soul food” tropes on social media:
“There is this complete confusion between what looks nice – between the bucolic, romantic, aesthetic and cottagecore that you can post up on Instagram – and what we actually need in order to intervene effectively in this huge Leviathan of a system which is going to crush us into dust.”
In his closing remarks, Lenton mused that the research community was on a quest to discover the “recipe” behind positive tipping points. He explained:
“We’re passionate as researchers to seek out the early opportunity signals that systems we want to get rid of might be able to get tipped out of.”
Having a toolkit for identifying the “generic” signals of when an incumbent system is showing signs of destabilising could guide efforts from activists, policymakers and investors to drive positive change for the planet, he said.
Lenton said upcoming research, set to be published in Sustainability Science, represented a “first attempt” at a methodology “for anyone who wants to ask whether a system has the potential for a positive tipping”. The methodology in question would also seek to answer the following questions, he said:
“If [a system] has [the potential to tip], how close is it? What factors would influence it? In particular, what could bring it forward? And then what actions could influence those factors to tip other systems?”
Lenton urged scientists at the conference to help him “refine and apply” the methodology. He also urged colleagues to keep “documenting” evidence of positive tipping over the years ahead. He explained:
“There is a theory of change here. We have got to enable each other to learn faster [and] to spread these initiatives better.”
Along with the main plenaries, the conference included around 50 breakout meetings, split between “research sessions” and “action workshops”.
Among the new research being presented at these sessions were early results from the “TIPMIP” international modelling project.
Rockström told Carbon Brief the “biggest change” in tipping-points science since the first conference in 2022 is the launch of TIPMIP. He said:
“The most solid scientific basis in the IPCC are all the ‘MIPs’, the modelling comparison programmes. The biggest one is CMIP [the Coupled Model Intercomparison Project], which gives us the data and the scenarios to be able to deliver the Paris Agreement.
“Now, we finally have a MIP for tipping points – and the tipping point comparison community is here at the conference, as well as [scientists from] the big Earth system models. Big tipping modelling analysis [is underway] on AMOC risks, on the Amazon rainforest, on permafrost and the ice sheets. That is a major advancement.”
Dr Jeremy Walton, who leads the software engineering team for the UK Earth System Model at the Met Office Hadley Centre, kicked off one research session by unpacking the Earth system modelling “experiment protocol” within TIPMIP. This is a “framework for the modelling and investigation of climate overshoot and tipping points”, he explained, which sets out a consistent set of “idealised” – or simplified – experiments for scientists to conduct in order to build up a large dataset of results from lots of climate models.
The figure below illustrates these experiments, which include control runs with no global warming (black line), runs where warming is stabilised, such as at 2C or 4C (green lines) and further runs where warming is subsequently reduced via carbon removal (blue lines).
In all cases, warming first “ramps up” at a rate of 0.2C per decade “because that matches the observed rate in recent years”, Walton said.
Prof Colin Jones from the University of Leeds presented some initial results from the idealised experiments for the Antarctic ice sheet, carried out by Dr Kaitlin Naughten of the British Antarctic Survey.
The analysis – currently unpublished – focuses on the massive Ross and Filchner-Ronne ice shelves, which float on the ocean and hold back land ice behind them. At the moment, Jones explained, they are both “cold-water cavities”, in that the ocean water beneath the shelves is “below the freezing point of sea ice”. However, if they “tip” to “switch to being warm-water cavities, then there’s a risk for rapid loss of ice”, he said.
The switch happens because melting of Antarctic ice adds freshwater beneath the ice shelves. This reduces the “density barrier” between the cavity and warmer open ocean, said Jones, reaching a “sudden point where the salinity is sufficiently low that the density has changed and it allows open ocean water” to get into under the ice shelves.
Their model runs suggest that there is a “danger zone” for the Ross ice shelf of around 3.5-4C, Jones said:
“If you go more than 4C, it will always tip [in model runs]…If you stay below about 3C, it will never tip.”
For the Filchner-Ronne ice shelf, “it is basically the same mechanism, but it happens at a higher warming level”, noted Jones, with a “danger zone” around 5-5.5C.
Also focusing on Antarctica, Sacha Sinet from Utrecht University presented analysis on the interactions between AMOC and the polar ice sheets, with results suggesting that the loss of the Antarctic ice sheet could actually stabilise the AMOC and prevent it from collapsing.
Sinet’s research is currently being reviewed before potential publication.
Another study on Antarctica was published on the opening day of the tipping points conference. The research, led by Dr Alessadro Silvano from the National Oceanography Centre, uses satellite data to reveal a marked increase in surface salinity across the Southern Ocean since 2015, coinciding with a “dramatic decline” in Antarctic sea ice.
The findings suggest that the Southern Ocean “might have entered a new system”, Silvano said. He explained how he has been observing an increase in salinity in the top 100 metres of the ocean. This is “counterintuitive”, he said, as “you think the more melting of ice, then you should freshen the ocean instead”.
The increase is because the ocean is becoming “less stratified”, meaning that warm water – which is also more salty – is “able to reach the surface of the ocean more”, making is harder for sea ice to regrow. he explained:
“And this is circumpolar. So it’s happening everywhere you see the increase in salinity.”
This has the potential to drive a self-reinforcing feedback loop, Silvano wrote in an article for the Conversation:
“We may have passed a tipping point and entered a new state defined by persistent sea ice decline, sustained by a newly discovered feedback loop.”
When asked by an audience member whether solar geoengineering could help, Silvano noted: “The problem for Antarctica is that melting is driven by the ocean. You cannot stop warming in the ocean, so that, to me, is an impossible task.”
Away from Antarctica, Dr Bette Otto-Bliesner of the US National Center for Atmospheric Research introduced another “MIP” – the What If Modeling Intercomparison Project (WhatIfMIP), which aims to investigate the consequences of what happens if a tipping point is crossed.
In particular, the programme will look at the cascading effects of one tipping element on another, including Amazon dieback, shifts in boreal forests, AMOC collapse, permafrost loss and the collapse of the Greenland and West Antarctic ice sheets, Otto-Bliesner explained.
One area of focus will be on the potential implications of “Sahel greening”, Otto-Bliesner said:
“We don’t think the Sahara is going to green in the next few centuries. But there is a project in the Sahel region called the Great Green Wall Initiative, where they’re actually planting trees. They’ve already started this…So what are the consequences of that, in terms of precipitation, drought, but also…heatwaves?”
In another talk, Caroline Wallington – from the Centre for Sustainability Transitions at Stellenbosch University in South Africa – presented a global analysis of ecosystems and people at risk of 21 different ecological “regime shifts”.
The findings show that 26% of the global land area is at risk of at least one ecological shift, covering 3.4 billion people, or 43% of the global population.
Around 31% of corals are at risk of a regime shift, Wallington said, while 30% of tundra is at risk from a transition to boreal forest and 28% of tropical forests are at risk of tipping into savannah.
The regions of the world at highest risk include the south Pacific, south-east Asia and central America, Wallington noted. Some of the most populous countries in the world are at risk from these regime shifts, she added, including China, India, the US and Indonesia.
Dr Nico Wunderling, from the Center for Critical Computational Studies at Goethe University Frankfurt and the Potsdam Institute for Climate Impact Research, presented on how tipping point risks are affected by “overshooting” temperature goals, such as the Paris Agreement’s 1.5C limit.
His work indicates that “tipping risks are even non-negligible now at global warming levels of 1.3-1.5C”, while overshooting 2C would mean “entering a very high risk zone for climate tipping elements”.
Wunderling presented some early results – currently undergoing peer review – on how the risk of Amazon dieback depends on both the levels of warming and deforestation.
When only warming is considered, current pathways to 2.7-2.8C above pre-industrial levels “seem to still relatively keep the Amazon rainforest at a safe level”, he said. However, he added, when deforestation is included, tipping risks become much closer – “to levels that are well within the Paris Agreement, so about 1.5-2C”.
Wunderling recently wrote a Carbon Brief guest post on “cascading” tipping points, indicating that the “majority of interactions between tipping elements will lead to further destabilisation of the climate system”.
In the closing plenary, Rockström confirmed that PIK would host a tipping points conference in Berlin in 2027.
He also revealed that plans were afoot to host a tipping points conference in 2026 in Malaysia, following discussions with Prof Jemilah Mahmood of the Sunway Centre for Planetary Health in Kuala Lumpur.
Rockström said this reflected the need to host the conference in the global south and the importance of “building momentum” around tipping point risks and opportunities.
He added that the Malaysia-hosted conference could be held “in connection” with the COP31 climate summit, should Australia’s bid to host the UN talks in 2026 prove successful.
Meanwhile, a second global tipping points report is earmarked for the latter half of 2025.
(Carbon Brief covered the first global tipping point report in 2023).
Lenton told Carbon Brief the upcoming report will be “tighter” than its predecessor and “major” on governance issues.
Explaining the rationale for giving governance top billing in the report, Lenton said:
“We want to lead on the things we need. We clearly need some improvements in governance and institutions to get on top of both the tipping point risks and, arguably, the opportunities. Everyone can see that – it has been repeated several times already at this meeting. So, it is important to be clear what differences [governance] makes and what different kinds of governance we are calling for.”
The report will also offer an “update on tipping point risks and opportunities”, Lenton said, and include three case studies looking at Earth system tipping points – the shutdown of AMOC, Amazon dieback and coral die-off. It will also feature one “localised” example of a glacier tipping point and its consequences.
The case studies are designed to provide “more specific and concrete guidance” on how to avoid tipping risks, according to Lenton.
In addition, Ricarda Winkelmann told Carbon Brief that she and her colleagues will be answering a “call on the scientific community to put together a robust risk assessment on tipping dynamics”. This will involve “creating a first global atlas of tipping financial risks”, she explained – in time to feed into the seventh assessment report (AR7) of the Intergovernmental Panel on Climate Change (IPCC).
Discussing AR7 with Carbon Brief, Rockström said he was “very disappointed” that, at a meeting last year, countries decided not to include a special report on tipping points in the IPCC’s AR7 cycle.
This happened because the topic “makes policymakers and some member countries around the world very uncomfortable”, Rockström said.
Despite the “illogical” decision, the AR7 assessment reports will “see much more tipping-point science”, added Rockström, “for the simple reason that we have TIPMIP [and] we have a much broader community now – it’s entering the mainstream of Earth system modelling”.
This is “so important” in order to narrow uncertainty ranges in projections of tipping points, Rockström argued:
“I am of the view that one reason why we’re not acting faster on the climate crisis – one of many reasons – one fundamental reason is that we in the scientific community are not able to communicate precision on risk.
“Science on tipping point risk is so important because so many actors are using the uncertainty ranges as an excuse for not acting. So, as long as the AMOC continues to have medium confidence, then you can go on forever kicking the can down the road.”
The Exeter meeting comes against a backdrop of cuts to climate science funding in the US, including to the budget of the National Oceanic and Atmospheric Administration (NOAA).
Lenton said the tipping-point community was “traumatised” by the developments – “especially [on behalf] of colleagues in the US” who had lost their jobs. He added:
“It is already influencing things. If we lose NOAA and we lose our state-of-the-art assessment of the state of the oceans – these are dangerous erosions of our ability to sense whether the Earth system is destabilising or not. This is a fundamental loss.”
During the conference, the convenors drafted a conference statement, which they encouraged delegates to endorse.
With global warming approaching the Paris Agreement 1.5C limit, the statement warns that this places “humanity in the danger zone where multiple climate tipping points pose catastrophic risks to billions of people”.
It says that the “window for preventing these cascading climate dynamics is rapidly closing”, adding:
“We join the COP30 presidency in calling on governments to enact policies that help trigger positive tipping points in their economies and societies, which generate self-propelling change in technologies and behaviours towards zero emissions.”
The statement concludes by arguing that “decisive policy and civil society action” is needed for the world to “tip its trajectory from facing unmanageable climate tipping point risks to seizing positive tipping point opportunities”.
TAX CREDITS CRUSHED: A major budget bill passed by US congress this week is “poised to remake American energy by slashing tax breaks for wind and solar power and electric cars”, reported the New York Times. The legislation, which was “muscled” through by Republicans, “provides a boost to fossil fuels and dismantles many of the biggest actions the federal government has ever taken to fight climate change”, the newspaper said.
‘CRACKDOWN’: The version of the bill approved by the Senate on Tuesday included “compromise language” that gave wind and solar projects one year to begin construction to claim current tax credits, noted Politico. “Hard-line” Republicans in the House of Representatives told the outlet that they backed the bill only after receiving assurances from Donald Trump that he would use executive action to further “constrict” wind and solar.
LAB LIABILITY: The bill, which is expected to be signed by Trump today, also “seeks to defund” multiple climate labs, according to CNN. This includes the Mauno Lao laboratory in Hawaii, where measurements since 1958 have produced the iconic “Keeling Curve” of rising atmospheric CO2, the outlet noted. See below for more on the emissions impact of Trump’s bill.
RED ALERTS: At least eight people died across Europe as a heatwave gripped much of the continent, reported Reuters, “triggering health alerts and forest fires and forcing the closure of a nuclear reactor at a Swiss power plant”. The New York Times quoted UN secretary general António Guterres, who said: “Extreme heat is no longer a rare event – it has become the new normal.”
RECORD-BREAKING: Both Spain and England had their hottest June on record, noted BBC News, with the Spanish weather service saying the average of 23.6C “pulverised records”. The outlet added that France registered its second-hottest June, while the Guardian reported that Portugal hit a provisional record high for June of 46.6C.
FLASH FLOODS: Elsewhere, a record downpour in the central Chinese province of Hubei brought a month’s worth of rain in just 12 hours to the city of Xianfeng, reported Reuters. Authorities moved 18,000 people to safety, the newswire said. Flooding in India’s northern state of Himachal Pradesh left five people dead, reported the Hindustan Times.
The amount by which “climate aid” given by the UK government to developing countries was inflated through controversial changes to the way climate finance is now being designated, Carbon Brief analysis showed.
(For more, see Carbon Brief’s in-depth daily summaries of the top climate news stories on Monday, Tuesday, Wednesday, Thursday and Friday.)
Trump’s dismantling of climate policy means the US will add an extra 7bn tonnes of emissions to the atmosphere from now until 2030, compared to meeting its former climate pledge under the Paris Agreement, according to new Carbon Brief analysis of modelling from Princeton University. The approval of Trump’s megabill repealing clean-energy tax credits, alongside a series of executive orders, means that US emissions are now set to drop to just 3% below current levels by 2030 – effectively flatlining – rather than falling 40% as required to hit the now-defunct target, according to the analysis.
This week, delegates at the Global Tipping Points 2025 conference in Exeter tell Carbon Brief which potential tipping “element” in the Earth system they are most worried about.
“The Atlantic Meridional Overturning Circulation, or AMOC, for sure. The consequences of crashing that would be devastating globally – and also for where I live in the UK. By our own calculation, we could have less than half the viable area for growing a couple of major staple crops, wheat and maize, worldwide. We would have a widespread water crisis. We could have collapses of the monsoons in West Africa and India that would displace hundreds of millions of people. It is hard to see that in anything other than a catastrophe.”
“So I am thinking about this from a risk perspective – so both the likelihood as well as the impacts – and I think the answer depends on that. Because when it comes to the likelihood and the particular threshold – and we know about those – I’m mostly concerned about the Greenland and the West Antarctic ice sheets. This is because we know that, even at lower warming levels, they’re already at risk of transgressing tipping points in certain regions.
“But when it comes to the impacts and also the timescales over which those play out, there are other tipping elements that worry me most. In particular, regional tipping elements. So, if we think of the mountain glaciers, for instance, these impacts are already experienced right now and several mountain glaciers are undergoing these accelerated changes.”
“I am worried about all of them. But, for the immediate future, I am particularly worried about tipping points that involve the biosphere and humans due to breaching thresholds for heat or drought that then ripple into food availability, livelihood and ecosystems. The Earth system tipping points will do that, too, but maybe a little bit later. Examples are coral diebacks triggered by marine heatwaves, forest change and fires, and droughts threatening livelihoods and putting people on the move.
“I did a research project on the US dustbowl and the trigger was drought causing vegetation and crop dieback, then [leading to] extreme heat and dust storms in response – and migration, as memorialised in [the 1939 John Steinbeck novel] The Grapes of Wrath. And, now with warming, all droughts get supercharged.”
“The Amazon is a very serious tipping point, because [dieback] could release around 250bn tonnes of CO2 by 2100 – which will make it impossible to [limit global warming] at 1.5C. We could also lose the largest [host to] biodiversity on the planet, which would induce a tremendous, large number of epidemics and several pandemics. Also, of course, the Amazon forest controls aspects of the global climate. In South America, the climate is entirely controlled by the Amazon forest.”
Carbon Brief will publish further coverage of the Global Tipping Points conference next week.
‘CLIMATE ACTION IS UNSTOPPABLE’: In a talk at the recent TED Countdown Summit 2025 in Nairobi, former US vice-president Al Gore explained why the narrative of “climate realism” is a “myth”.
PROTESTOR IN PRISON: A BBC Radio 4 Currently documentary followed the story of a “law-abiding Middle England mum”, who received a four-year prison sentence for a Just Stop Oil protest on the M25 motorway.
‘FROM THE GREEN TO THE UNSEEN’: In its L is for Labour YouTube show, the Migration Project asked what a “just transition” to electric vehicles would look like for the traditional automotive industry and its workers in India.
DeBriefed is edited by Daisy Dunne. Please send any tips or feedback to debriefed@carbonbrief.org.
This is an online version of Carbon Brief’s weekly DeBriefed email newsletter. Subscribe for free here.
Since winning office last November, he has issued a series of executive orders and is poised to sign his “big beautiful bill” that effectively terminates Biden-era climate policies.
Carbon Brief’s analysis of modelling from the Princeton University REPEAT Project shows that this means US emissions are now set to drop to just 3% below current levels by 2030 – effectively flatlining – rather than falling 40% as required to hit the now-defunct target.
This would leave the US around 2bn tonnes short of its greenhouse-gas emissions target for that year, adding emissions equivalent to around 4% of the current global total each year
To put this in context, it is roughly the annual output of Indonesia, the world’s sixth-largest emitter.
Trump is already withdrawing his nation from its international climate obligations under the Paris Agreement.
The passage of the new Republican-backed “megabill” means that US climate targets pursued by Trump’s predecessor now appear firmly out of reach.
Trump is due to sign the so-called “big beautiful bill” into law after it was approved by the Republican-controlled US Congress on 3 July.
This “megabill” removes virtually all of the tax credits for renewable energy, electric vehicles and clean manufacturing that were at the core of Biden’s landmark Inflation Reduction Act (IRA).
(Ahead of the US presidential election last year, Carbon Brief estimated that, by reversing the IRA and other key policies, a Trump administration would add 4bn tonnes of emissions by 2030, compared to a continued Biden administration.)
Since his return to the White House, Trump has moved to strip away his predecessor’s climate policies, including via a series of executive actions. This includes targeting vehicle fuel-efficiency standards and power sector emissions standards.
The passage of the new bill means US solar and wind power expansion will likely slow down, as will sales of electric vehicles and energy efficiency improvements. The combined effect of these policy rollbacks can be seen in the chart below, based on modelling by the REPEAT Project.
Carbon Brief has compared the impact of Trump’s policies, including the megabill, to a pathway on which the US meets its former target, under the Paris Agreement, to cut greenhouse gas emissions by 50-52% from 2005 levels by 2030.
The cumulative gap between this pathway and the Trump administration’s trajectory amounts to 7bn tonnes of emissions over the next five years.
Based on the most recent central estimate of the “social cost of carbon” in 2030 from the US Environmental Protection Agency (EPA), published under the Biden administration, those 7bn tonnes of extra emissions would cause global climate damages worth more than $1.6tn.
Under this new set of US policies, emissions are only expected to be 20% lower than 2005 levels by 2030, rather than 50-52%, meaning the nation would be 2bn tonnes short of its goal.
This amounts to just a 3% drop from 2024 levels by 2030, meaning emissions are effectively flatlining.
Among the hundreds of provisions in the new Republican-backed bill are several key rollbacks that are expected to affect US emissions.
Under the IRA, wind and solar projects could receive tax credits up to 2034. Following the Republican bill, most projects would need to start construction within the next year to qualify.
Without federal support, the pipeline of new renewable-energy projects is expected to contract.
The REPEAT analysts estimate that cumulative new solar capacity additions will drop by 29 gigawatts (GW) by 2030 and around 140GW by 2035. For wind power, the decrease is set to be 43GW by 2030 and 160GW by 2035.
Some renewable projects will likely be built without support, but developers will need to contend with other Trump administration policies, such as stopping federal windfarm approvals.
The lost renewable capacity is unlikely to be entirely replaced by fossil fuels, due to a multi-year backlog in the construction of gas-fired power plants.
Tax credits for nuclear and geothermal power have been retained until 2036 in the bill. While these projects generate clean electricity, they can also take a long time to build.
Other key policies in the new bill include the removal of tax credits worth up to $7,500 to purchase electric vehicles, which could result in tens of millions fewer such cars and vans being sold. Ending tax credits for low-carbon manufacturing is also expected to undo progress in building clean technologies, such as solar panels and electric cars, domestically.
Beyond its effect on US emissions, various early analyses have suggested the Republican-backed bill is likely to increase energy prices and lead to job losses.
REPEAT estimates household energy costs are likely to be $165 higher in 2030 and more than $280 higher by 2035, following the passing of the bill.
Some of this increase can be attributed to fewer electric vehicles on the road, leading to higher petrol and diesel consumption and prices. Slowing construction of solar and wind projects as power demand increases will also likely affect the cost of electricity.
Without tax credits to boost the construction of new generation capacity, residential electricity prices are set to increase by 7% – or $110 – by 2026, for the average US customer, according to analysis conducted for trade body the Clean Energy Buyers Association.
In the state of Wyoming, the same analysis found that electricity prices may rise by as much as 30% over the next year. Other firmly Republican states, such as North Carolina and Tennessee, are also expected to see near-term price rises in the double digits.
Modelling of the impact of the Trump administration’s “big beautiful bill” is from the REPEAT Project, a joint initiative of the Princeton University ZERO Lab and Evolved Energy Research.
The project has assessed the emissions impact of the executive actions that the Trump administration has already taken to unwind Biden-era policies, as well as the bill itself.
Carbon Brief compared this trajectory out to 2030 with a straight-line pathway towards the official US climate target for 2030. This is set out in the US’ nationally determined contribution (NDC) under the Paris Agreement. It is worth noting that the Trump administration is withdrawing the US from the Paris Agreement.
In a proposed amendment to EU climate legislation, the commission has laid out what it calls a “new way to get to 2040”, including “flexibilities” to ease the burden on member states.
Besides the limited use of carbon credits, the proposal also gives a potentially larger role to carbon dioxide (CO2) removal technologies and leaves the door open for weaker sectoral goals.
It has drawn criticism from climate NGOs and left-leaning European politicians, who argue that it “waters down” the EU’s climate ambitions and presents “considerable risks”.
Yet, the proposal is seen by many as an acceptable compromise option, following strong pushback from many member states to the 90% target, originally proposed last year.
With all nations expected to come forward with new international climate targets for 2035 by September and ahead of the COP30 climate summit, the 2040 goal will also be crucial in determining where the EU’s pledge lands.
In this Q&A, Carbon Brief outlines what the amendment proposed by the commission includes, why it has proved controversial and what is expected to happen next.
The European Commission has proposed an amendment to the EU Climate Law, which would set a target for a 90% reduction in net greenhouse gas (GHG) emissions by 2040, compared to 1990 levels.
It will “give certainty to investors, innovation, strengthen industrial leadership of our businesses and increase Europe’s energy security”, the commission says.
In a statement, Ursula von der Leyen, president of the European Commission, added:
“As European citizens increasingly feel the impact of climate change, they expect Europe to act. Industry and investors look to us to set a predictable direction of travel. Today we show that we stand firmly by our commitment to decarbonise [the] European economy by 2050. The goal is clear, the journey is pragmatic and realistic.”
The proposal includes new “flexibilities”, such as a limited role for “high-quality international credits” from 2036, the use of domestic permanent emissions removals within the EU Emissions Trading System (EU ETS) and additional flexibilities across certain hard-to-decarbonise sectors.
These additional flexibilities are designed to allow countries to meet targets in a cost-effective and “socially fair” way, the commission adds. It says they will provide the possibility that a member state could compensate for a struggling land-use sector with overachievement in other areas, such as emissions from waste or transport.
The target will “send a signal to the global community” that the EU will “stay the course on climate change, deliver the Paris Agreement and continue engaging with partner countries to reduce global emissions”, says the commission.
It has been announced ahead of the UN COP30 climate summit in Belém, Brazil in November.
The European Commission says it will now work with the council presidency – representing EU member state governments – to finalise the EU’s climate pledges for 2035, so that the EU can submit its “nationally determined contribution” (NDC) under the Paris Agreement.
The EU was among the 95% of countries that missed the UN deadline to submit their NDCs by February of this year.
A recent update from the European parliament noted that the EU “needs to update its NDC…by September”, in order to meet an extended deadline from the UN.
In 2023, independent advisory body the European Scientific Advisory Board on Climate Change recommended that the EU should aim for net emissions reductions of 90-95% by 2040, compared to 1990 levels.
As such, the advisory board said that the bloc would need to limit its cumulative emissions from 2030-50 to 11-14bn tonnes of CO2 equivalent (GtCO2e), in order to be in line with bringing global warming down to 1.5C by the end of the century.
The 90% emissions reduction figure set out by the EU is on the lower end of guidance.
The European Commission’s new proposal builds on previous targets and roadmaps, representing a significant step towards enshrining the 2040 target in law.
In July 2021, the European Climate Law officially entered into force, setting a target of a net GHG reduction of at least 55% by 2030, compared to 1990 levels, as shown in the chart below.
Rules were introduced governing sectors, such as clean energy, energy efficiency and transport, among others, to help meet this target.
If all were successful in their implementation, they would reduce emissions by roughly 57% by 2030, according to a European parliament assessment in 2022.
Subsequently, the commission has been working on developing a target for 2040, as an interim benchmark between the 2030 target and the EU goal – announced in 2018 – to be “climate neutral” by 2050. At this point, the bloc would reach net-zero emissions overall and would stop adding to global warming.
In 2024, the commission published an impact assessment, detailing the underlying qualitative analysis it had undertaken around emissions reduction targets for 2040.
This, together with the European Scientific Advisory Board on Climate Change’s report (detailed above) and advice from the UN’s Intergovernmental Panel on Climate Change, formed the basis for the 90% target, the commission says.
The headline 90% target for 2040 was announced as part of a roadmap outlined by the commission in February 2024.
The roadmap kicked off a lengthy process in which EU politicians and institutions worked to cement the details of this target, ahead of this week’s proposal on turning it into law.
This process included “substantial engagement” with member states, the European parliament, stakeholders, civil society and citizens, the commission says.
In particular, certain European countries have been placing pressure on the commission to change or adapt the 2040 target, slowing the progress of this week’s proposal, which had been due out in February.
For example, Italy called for the goal to be weakened and France asked for “flexibility” to be introduced (See: Who has supported and opposed the proposed climate target?).
The commission hopes that publishing the proposed target now will allow it to be factored into the EU’s upcoming NDC, in which it will establish an emissions reduction target for 2035.
The European Commission’s proposal sets out a “pragmatic” pathway towards the 2040 target, including specific measures to give EU member states “flexibility”.
Of these, the one that has received the most attention is to allow limited use of international carbon credits, under Article 6 of the Paris Agreement, starting in 2036.
In effect, this flexibility means that emissions within the EU would only need to fall to 87% below 1990 levels by 2040, with the remaining 3% taking place overseas.
This would mean member states could buy credits generated by emissions-cutting projects in other countries and count those cuts towards their own targets.
Other nations, including Japan and Switzerland, have already welcomed the use of international credits to meet their climate goals.
In an unusual intervention that coincided with the proposal itself, the European Scientific Advisory Board on Climate Change stated that the EU should not count such credits towards the 2040 target. It said:
“Using international carbon credits to meet this target, even partially, could undermine domestic value creation by diverting resources from the necessary transformation of the EU’s economy.”
The board also mentioned other concerns that are frequently levelled at “carbon offsetting”, such as credits not resulting in real-world emissions cuts.
The commission’s proposal refers to “high-quality international credits under Article 6”, but does not specify which types of credit. This leaves the door open for lower quality options.
For example, carbon trading under Article 6.2 is subject to far less oversight than trading of Article 6.4 credits.
The proposal also states that: “The origin, quality criteria and other conditions concerning the acquisition and use of any such credits shall be regulated in union law.”
This suggests that the EU would conduct its own assessment of any credits used by member states, beyond the rules that have been negotiated at an international level.
Jonathan Crook, the lead expert on global carbon markets at Carbon Market Watch, tells Carbon Brief that additional safeguards would be “essential”, given outstanding issues with Article 6 carbon credits.
A Q&A accompanying the commission proposal states that credits would be bought from “credible and transformative” projects in nations with Paris-aligned climate goals.
It mentions direct air carbon capture and storage (DACCS) and bioenergy with carbon capture and storage (BECCS) as examples of the kinds of projects that the EU could source credits from.
This could severely limit the pool of available credits, because – as it stands – almost all carbon credits are from tree planting, forest conservation and clean-energy projects.
DACCS and BECCS projects could result in relatively permanent carbon removal. Crook says this would be one of the “many necessary safeguards” needed for credit purchases, although he points to potential issues with such projects. He adds:
“This potential durability criterion is only mentioned in the Q&A, rather than in the actual commission proposal and so currently has very limited standing unless it is introduced [into the legal text] during the co-legislation process.”
There are two additional “new flexibilities” mentioned in the commission’s proposal, to help member states meet the 2040 emissions target more easily.
One is the inclusion of permanent carbon dioxide (CO2) removal in the EU ETS, something that was already being discussed as part of an ETS revision.
This would mean that DACCS and BECCS projects in EU member states could sell credits to help high-emitting companies, such as steel plant operators, stay within their ETS limits.
Paying for such credits could become more appealing as the number of available emissions “allowances” under the overall “cap” for ETS system shrinks and the allowances become more expensive.
The commission says this would help to “compensate for residual emissions from hard-to-abate sectors”, referring to those that are expensive or difficult to reduce to zero.
The need to remove CO2 from the atmosphere is widely recognised and inclusion in the ETS could help to drive investment into early-stage technologies, such as DACCS.
However, there are concerns that focusing on removals diverts investment from readily available technologies that cut emissions, such as electric-arc furnaces for steel plants.
In its recommendations, the European Scientific Advisory Board on Climate Change says there should be separate targets for emissions reductions and removals. This would ensure the removals contribute to EU targets “without deterring emission reductions”, it says.
Finally, the commission’s proposal also includes a vague mention of “enhanced flexibility across sectors, to support the achievement of targets in a cost-effective way”.
Linda Kalcher, executive director of the thinktank Strategic Perspectives, tells Carbon Brief that this is “alluding to the fact that we might see weakening of some laws”.
Michael Forte, a senior policy advisor at thinktank E3G, expands on this, noting that it could mean member states adjusting emissions targets between different parts of the EU climate architecture, depending on where they were over- or underperforming.
“I would infer that this means letting member states transfer a greater share of their mitigation efforts between these different instruments,” Forte tells Carbon Brief.
Kalcher notes that such changes cannot be regulated in this law, but instead would need to be part of the expected 2040 framework or other pieces of law:
“They are more alluding to future changes, instead of making them now. So that…gives confidence to the countries that have concerns [about the 2040 target] that something will happen.”
Climate campaigners and left-leaning politicians were highly critical of the “flexibilities” included in the commission’s proposal, in particular the use of international carbon credits.
The options proposed were described by civil-society groups as “creative accounting” and a “dangerous new precedent” that relies on “outsourcing Europe’s responsibility” to other countries.
The European parliament’s centre-left Socialists and Democrats coalition issued a statement warning that “the inclusion of international carbon credits as a means to meet the target carries considerable risks”.
Critics also noted that using such flexibilities contradicted the official advice offered by the European Scientific Advisory Board on Climate Change.
Yet the proposal, presented as a “new way to get to 2040”, is widely viewed as an attempt to find a political compromise against a tricky geopolitical backdrop.
It allows the EU to aim for the target set out by its scientific advisers, albeit at the lower end of the “90-95%” emissions reduction that had been proposed. This is in spite of a strong political pushback from some member states.
A statement released by Peter Liese and Christian Ehler, German members of the European parliament’s centre-right European People’s Party (EPP) group, explained:
“We think it’s very dangerous to criticise the European Commission because they intend to include flexibility in their proposal on the 2040 target. We don’t see a majority in parliament nor council for any 2040 target without flexibility.”
Some member states, including Spain and Denmark, supported the 90% target without asking for major concessions. Others, including Poland and Italy, have argued for a less stringent headline goal.
Meanwhile, others pushed for some kind of compromise during discussions of the new target.
Notably, the newly elected, right-leaning German government gave qualified support for the 90% goal in its coalition agreement, subject to conditions such as the inclusion of international carbon credits. Other influential nations have also increasingly stressed the need for “flexibility” around the target.
Meanwhile, according to Politico, France has been part of a push – alongside “climate laggards” Hungary and Poland – to separate discussions of the EU’s domestic 2040 target from its international 2035 NDC pledge.
According to the news outlet, such decoupling could result in a weaker 2035 target, compared to the 2035 target that is expected to be derived from the 90% reduction 2040 goal.
The commission says its 2040 proposal goes “hand in hand” with its clean industrial deal strategy, its affordable energy action plan and its “competitiveness compass” plan.
Alongside tabling its 2040 climate goal, the commission issued a new “communication” on “delivering on the clean industrial deal”. (The deal was first announced in February.)
The communication says that “decarbonisation and reindustrialisation are two sides of the same coin” and reaffirms that the aim of the deal is to “enable the EU to lead in developing the clean-technology markets of the future”.
The commission says delivery of the deal is “already underway”. It points to the adoption of the clean industrial deal state aid framework on 25 June, an €85bn ($100bn) state-aid package for helping member states transition their economies.
Environmental law charity Client Earth said a draft version of the framework risked “entrenching support for fossil gas and fossil based low-carbon gases”.
The clean industrial deal communication also notes that the commission this week published recommendations on tax incentives for speeding up the energy transition.
On 18 June, the European parliament and council agreed on a commission proposal to simplify the EU’s Carbon Border Adjustment Mechanism (CBAM), a policy for taxing carbon-intensive imports at levels equivalent to the EU ETS.
The agreement introduces a new exemption threshold of 50 tonnes for CBAM goods, meaning small and medium-sized companies that do not exceed this weight of imports per year will now be exempt from the measure.
EU climate commissioner Wopke Hoekstra described it as a “win for both climate policy and competitiveness of our companies”, with the new measure meaning 90% of companies will now be exempt from the CBAM, but 99% of emissions will still be covered.
Previous analysis has found that, in isolation, the CBAM will have a limited impact on global emissions.
Before the target can be adopted, it must be agreed by member states and pass through the European parliament.
Once the parliament and national ministers have agreed on their separate positions, three-way “trialogue” negotiations between them and the commission can begin with the aim of finalising the 2040 legislative proposal.
All nations were asked to submit new 2035 climate pledges, known as “nationally determined contributions” (NDCs), to the UN by February of this year (see: What has the European Commission proposed?). The EU was among the vast majority of parties to miss the deadline.
UN climate chief Simon Stiell has now asked all parties to submit their NDCs “by September”. This is to allow time for the preparation of a report on the collective ambition of all nations’ pledges before COP30 in November.
The EU’s NDC will include an “indicative 2035 figure” derived from the bloc’s 2040 climate target, according to the commission.
The commission says it will work with the Danish presidency of the EU council and member states to finalise its NDC.
It is expected that the EU will aim to finalise both its 2035 NDC and its 2040 climate goal ahead of the next UN general assembly, which starts on 9 September in New York.
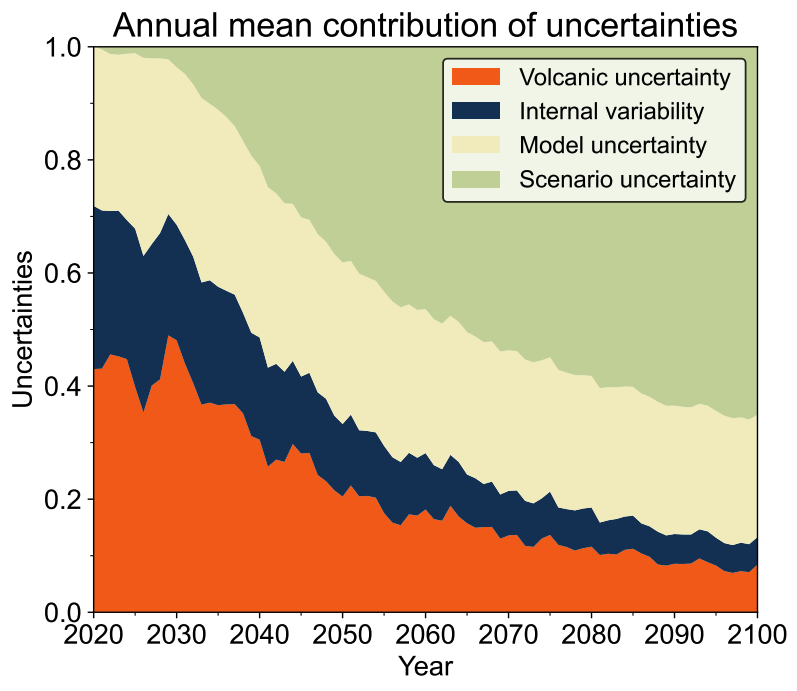