The Guardian jumps the gun on record June sea ice melt
The Guardian this week reports that recent rapid melting of Arctic sea ice has seen levels reach a “record low for June”. But it’s premature to be heralding June 2012 as having record low Arctic sea ice extent before the month is even over, particularly as sea ice extent is not currently tracking at record low levels.
The Guardian article says Arctic sea ice “has melted faster this year than ever recorded before”, under the online headline “Arctic sea-ice levels at record low for June”.
This headline could be read in two ways. The first interpretation is that Arctic sea ice extent for the month of June is at a record low. But can we know that before the month is out? The second is that at some point in June Arctic sea ice was at a record low. But does highlighting a few days of sea ice behaviour best illustrate what’s happening to the sea ice?
The piece also appeared in the print version of the Guardian yesterday with the headline “Arctic sea ice has melted faster than ever, say scientists”.
Melt season
The Arctic sea ice is in long-term decline due to man made climate change, but it’s not a uniform decline – sea ice cover changes with the seasons, and the weather in the region affects how far the sea ice extends, particularly as it melts towards the ice minimum in late September.
During melt season, Arctic sea ice seems to get a lot of media attention, often with rather confusing results. This Guardian article was prompted by analysis from the US National Snow and Ice Data Center (NSIDC), who provide daily updates and regular analysis of Arctic sea ice conditions.
Last week NSIDC reported rapid sea ice loss at the start of June, and sea ice extent “slightly below 2010 levels” – the previous low on record for this time of year.
According to the NSIDC:
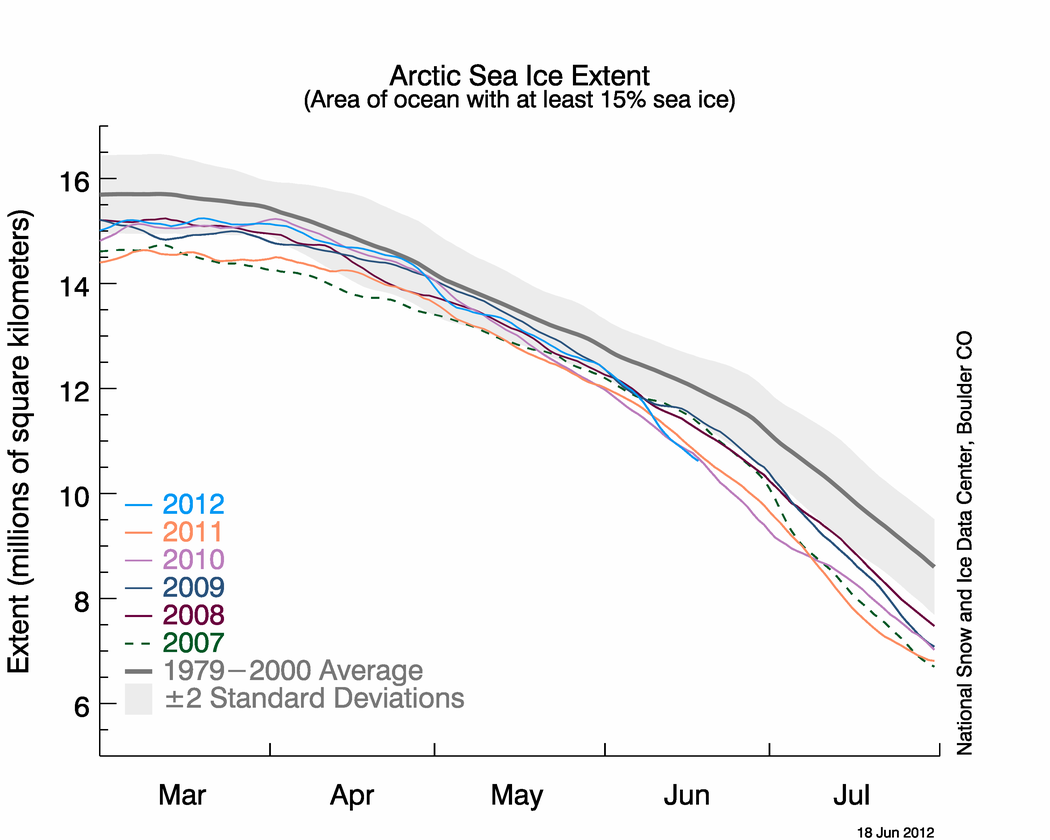
“On June 18, the five-day average sea ice extent was 10.62 million square kilometers (4.10 million square miles). This was 31,000 square kilometers (12,000 square miles) below the same day in 2010, the record low for the day and 824,000 square kilometers (318,000 square miles) below the same day in 2007, the year of record low September extent.”
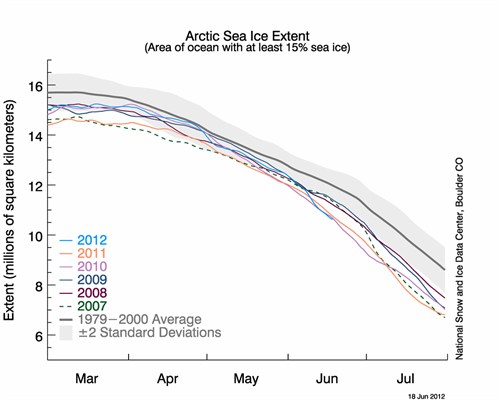
Sure enough, looking at the graph below, you can see that on the 19th June sea ice extent for 2012 was tracking below the 1979-2000 average, and below recent years:
Image - NSIDC Arctic sea ice 20120619 (note)
So at the time of the NSIDC update, sea-ice levels were at “record low levels” according to its analysis. The update describes ice loss as “unusually rapid … to this point in June”. The Guardian interpret this as sea ice melting “faster than ever”.
However, focusing on a snapshot like this can be dangerous – by the time the Guardian article reporting the NSIDC analysis came out, the situation in the Arctic had changed.
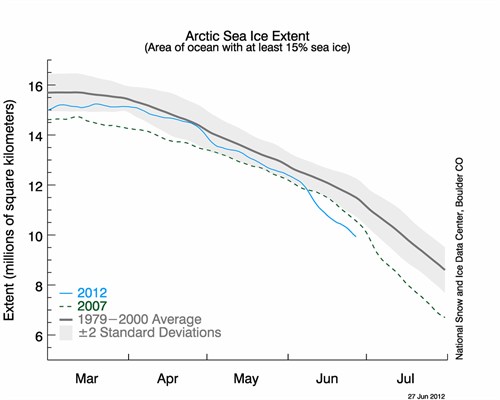
A few days later, it appears the rate of ice melt has slowed slightly, and sea ice extent no longer appears to be at the record low levels reached earlier in June:
Image - NSIDC Arctic sea ice 20120627 (note)
Obviously eyeballing a graph isn’t the most rigorous test, so we contacted NSIDC scientists Julienne Stroeve and Walt Meier to find out if the Arctic sea ice is still tracking at record low levels, and whether the Guardian has jumped the gun in declaring June 2012 a record low month.
Stroeve explained:
“When NSIDC’s mid-month post came out, the extent for 2012 was below that of 2010, […] which qualified it as a new record low for that date given the uncertainty in the measurement.”
But by the 27th June – when the Guardian article came out online – sea ice conditions had changed. By that time, Stroeve said, Arctic sea ice extent was “still tracking below that of 2007” – the year that saw a dramatic fall in amount of ice left at the end of the melt season – but it was no longer a record low level. According to Meier, on June 27th Arctic sea ice extent was “~200,000 sq km above 2010 in our 5-day average. This is still 2nd lowest in the record since 1979”.
The reason for the change? Probably the weather. The NSIDC’s mid-month Arctic sea ice analysis suggests that large-scale weather systems contributed to the rapid ice loss through the first half of June:
“A pattern of high pressure over the Beaufort Sea and low pressure over the Laptev Sea has been present for the past few weeks. This pattern is favorable for summer ice loss, by advecting warm winds from the south (in eastern Asia) to melt the ice and transport it away from the coastlines in Siberia and Alaska.”
But the Arctic weather systems have now shifted, as Stroeve explained to us:
“Right now there’s a low pressure system over the central Arctic, this tends to spread the ice cover out and slow the decline in the overall extent.”
June overall
And what about for the month of June as a whole? Is it too soon to suggest that June 2012’s sea ice extent is a record low? In short, yes.
Meier told us although it’s still possible June 2012 might be a record low for the month, “we won’t know where June 2012 falls until we get all the June data”, and Stroeve confirmed “Whether or not 2012 sets a new record low for the month of June remains to be seen”.
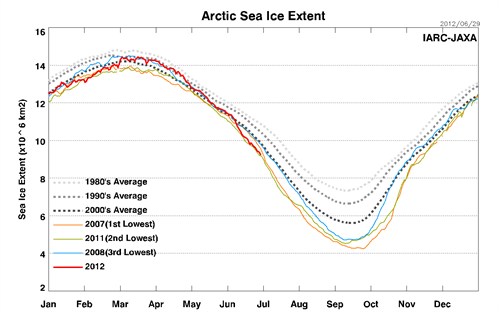
It’s worth pointing out that the NSIDC, although well respected and widely referenced, is not the only body that measuring the extent of Arctic sea ice. IJIS, for example, another research body providing measurements of Arctic sea ice extent, have not seen Arctic sea ice extent tracking at record low levels so far this year:
Image - JAXA Arctic sea ice extent 270612 (note)
Will this year’s June sea ice extent hit a record low? We’ll have to wait and see. This example underlines that it’s not that useful to focus on such short term measurements – what the ice is doing in a particular week, or even a particular year. Looking at the long term trend shows with greater certainty that the ice is in decline.
Short term variability, long term trend
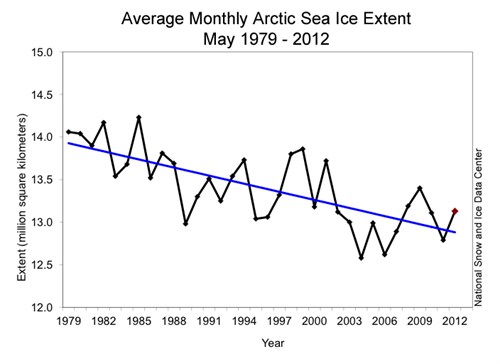
Finally, a couple of graphs to illustrate the point. A quick glance at the graphs for sea ice extent over the past thirty years shows that despite natural variation, there’s a clear downward trend in ice extent:
Image - NSIDC monthly Arctic sea ice May to 2012 (note)
On the other hand, looking at the daily record of ice measurements from the past few years shows that the melt rate changes from year to year, month to month and over shorter time periods, (as shown in the graph below) – so what the ice is doing ‘right now’ isn’t the best indicator for what’s going on overall.
Image - NSIDC Arctic sea ice 20120619 (note)
Picking one moment of measurement to focus on – as the Guardian have done – might make a good news story. But without putting the ice change into a longer-term context, it doesn’t give a particularly useful picture of how the Arctic ice is changing.