Climate change: Lovelock changes his mind but the planet’s still warming
Climate and environment commentator James Lovelock dialled back his previously pessimistic predictions about the world’s future climate in an MSNBC article yesterday. Why? Because, he says, “[ t]he world has not warmed up very much since the millennium“. As a result, he says he views his earlier work as “alarmist”.
Well, there’s no disagreement here that some of Lovelock’s earlier predictions – for example, that “[t]he climate war could kill nearly all of us and leave the few survivors living a Stone Age existence” – have never been representative of mainstream scientific thinking.
But based on the MSNBC interview, he now seems to argue that the world has currently stopped warming, and that as a result – we “don’t know what the climate is doing”. Unfortunately he’s still not doing a great job of representing scientific understanding of climate change.
Scientists are clear that the world hasn’t stopped warming – although if you spend time reading climate skeptic websites it’s a familiar argument, which relies on measurements of temperature at the surface of the Earth over short periods of time.
Peter Stott, head of climate monitoring and attribution at the Met Office, sums up this apparent confusion neatly. According to the MSNBC article, he “[…] agreed with Lovelock that the rate of warming in recent years had been less than expected by the climate models.”
Stott told us this was a
“gross simplification of what I was trying to explain – namely that the short term warming has been a bit less than the long term warming trend predicted by models – but this is entirely to be expected given that there will be variability of short term warming around the longer term trends (several decades) with some 10 or 15 year trends being larger and some smaller.”
And these surface temperatures are only a small part of the climate system – other measurements show us that most of the heat trapped in the climate system goes into the oceans, and that oceans have been warming pretty steadily during the last 55 years – giving us a valuable indicator of climate change.
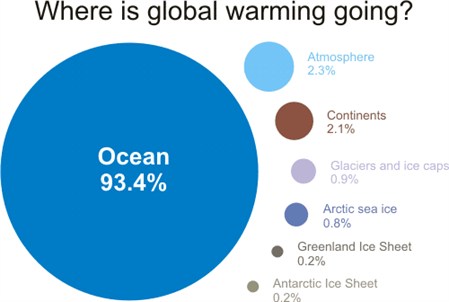
Where does the heat from man-made climate change go?
When people talk about global warming they normally mean increases in the average global surface temperature, as measured in the NASA, NCDC and Hadley Centre global temperature datasets. Given the amount of attention that these datasets receive, it might be surprising that global surface temperature is actually quite a small component of the climate system.
Global warming results from an energy imbalance in the climate system, where more heat energy is entering than escaping the atmosphere. The oceans account for over 90 per cent of the warming to the climate system since 1955, with the atmosphere, the continents and melting ice accounting for the rest.
Image - Global _warming _components (note)
Components of global warming for the period 1993 to 2003 calculated from IPCC AR4 5.2.2.3. Source: Skeptical Science
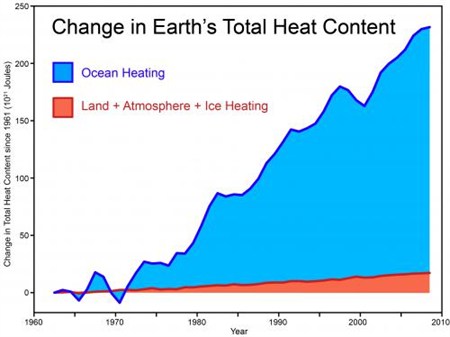
Research shows that the world’s oceans have warmed over the last 50 years, and probably even since the late 19th or early 20th century. About two-thirds of the heat going into the oceans is taken down and stored in the deep ocean, below 700 metres depth.
Image - Total _Heat _Content _2011_med (note)
Earth’s total heat content since 1960, data from Church et al. (2011). Source: Skeptical Science
Surface temperature
The continuing accumulation of heat energy in the oceans since 1955 accounts for over 90 per cent of warming. But since the claim that climate change has stopped relies on surface temperatures, lets consider them in more detail.
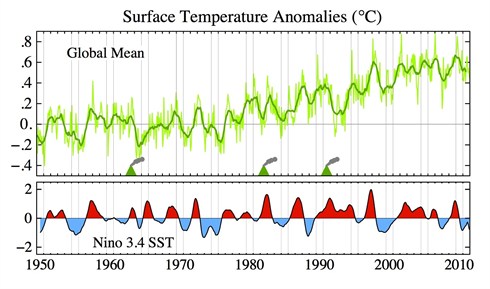
The instrumental record of surface temperature measurements show that the Earth’s average surface temperature has risen by close to 0.8 °C since the late 19th century. But the long-term rise has fluctuated – at times quite dramatically – from year to year and over decades. The graph below shows the measured global average temperature (from the three main temperature datasets). You can see the short-term temperature fluctuations superimposed on the long-term warming trend:
Image - Temp -anomaly -large (note)
Source: Met Office
Climate scientists have identified a number of different reasons – natural and man made – why the climate varies over the short term.
The natural climate cycle known as the El Niño Southern Oscillation (ENSO) is the spread of warmer or cooler than normal sea waters across the equatorial Pacific. ENSO is known to alter large scale climate patterns, and redistribute heat from the ocean to the atmosphere, causing a rise in global surface temperature. Research indicates that changes in ENSO variability may have caused climate ‘switches’ during the 1910s, 1940s, 1970s, and since 2001/02, having a short term effect on global temperatures. ENSO also affects the temperature of the surface ocean, but not the deeper ocean (below 700 metres), which has warmed more consistently.
Aerosols – tiny airborne particles that reflect heat back out to space – also have an effect. Aerosols can be natural – emissions from from volcanoes, for example, or produced by human activity. Some research suggests that man-made aerosols might have suppressed global surface temperature from the 1960s to the 1980s. Some researchers have suggested that the aerosols emitted from coal-fired power stations, in combination with ENSO and low solar activity, can explain why global temperatures did not rise significantly between 1998 and 2008.
Solar activity is another natural climate forcing – the sun goes through a roughly 11-year cycle of waxing and waning activity that has a small effect on global surface temperature.
The graph below showing global average surface temperature since the 1950s demonstrates the correlation between ENSO and volcanic eruptions, and global surface temperature fluctuations:
Image - Nasa _enso _temp _2011 (note)Global monthly and 12-month running mean surface temperature anomalies relative to 1951-1980 base period, and 12-month running mean of the Niño 3.4 index. Source: NASA GISS
In short, the surface temperature record is a balance between the long-term effects of greenhouse gas emissions, and short-term climate forcings.
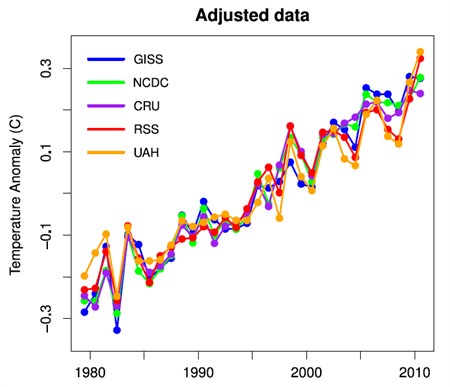
Subtract the effects of these short-term climate forcings and you are left with a pretty steady warming trend over the last thirty years, caused by man-made greenhouse gas emissions, as demonstrated in research from last year:
Annual averages of the adjusted data – the global warming signal. Source: Skeptical Science
NASA scientists have speculated about what global temperatures might do over the next few years, taking into account important natural climate fluctuations, and suggest:
“[…] The slowdown of warming is likely to prove illusory, with more rapid warming appearing over the next few years”
How long do you need to examine temperatures for?
Because of these natural variations in the climate, to pick out the long-term temperature increase arising from greenhouse gas emissions means examining at longer periods of time than short-term climate variations take place over. Researchers looking at every possible linear temperature trend (longer than two years) for the available surface temperature record found:
“Since 1945, all periods longer than 22 years indicate warming […] In contrast, changes shorter than a few decades can be either positive or negative. The recent cooling trend is evident in the global record beginning in 2001. Such changes, however, are not statistically significant and are in fact relatively common in the historical record.”
Modelling research suggests that we will probably see similar periods that don’t show a significant warming trend in the future, although as the warming trend increases over the coming century, such cooling periods will probably occur less frequently.
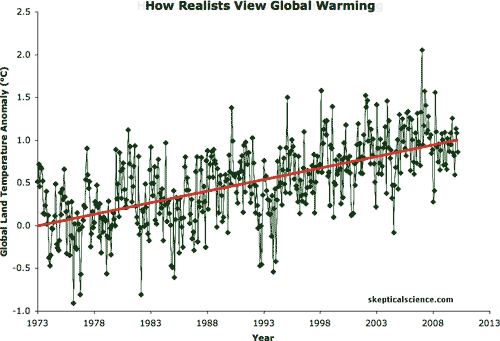
The Berkeley Earth Surface Temperature (BEST) group, led by scientist Richard Muller, tried to answer the concerns of climate skeptics about global surface temperature records by compiling its own version. The BEST study agrees with earlier conclusions, saying:
“[â?¦]the decadal fluctuations are too large to allow us to make decisive conclusions about long term trends based on close examination of periods as short as 13 to 15 years.”
The graphic below illustrates Muller’s point:
Image - Skepticsv Realists _500 (note)
BEST land-only surface temperature data (green) with linear trends applied to the timeframes 1973 to 1980, 1980 to 1988, 1988 to 1995, 1995 to 2001, 1998 to 2005, 2002 to 2010 (blue), and 1973 to 2010 (red). Source: Skeptical Science
As scientists continue to point out, you simply can’t confidently work out the long-term effect of greenhouse gas emissions on global temperature for periods of less than a few decades.
Skeptics on temperature trend
Given this body of research it just seems odd that the ‘no warming for 15 years’ or ‘warming has stopped’ meme has become such a favourite among climate skeptics.
For a start, the argument only looks at surface temperatures, and ignores the oceans completely. What’s more, the meme relies on ‘cherry picking’ a short section of data – too short to give a true climate signal. After all, even when short-term fluctuations give rise to hiatuses in the surface temperature record warming continues in the oceans. We discuss this further here.
Lovelock maintains he is not a climate “denier”. But the comments attributed to him by MSNBC suggest that somewhere along the line, his understanding of the relationship between short-term climate variations and the long-term warming trend has veered away from the mainstream again.
—
Update – Lovelock told MSNBC he doesn’t see himself as a “denier” and was more ambivalent about the term ‘skeptic’:
Asked if he was now a climate skeptic, Lovelock told msnbc.com: “It depends what you mean by a skeptic. I’m not a denier.”