How much do melting ice sheets contribute to sea level rise?
Scientists have published a definitive look at what’s happening at the poles – and it confirms both the Greenland and Antarctic ice sheets are shrinking. What’s more, the melting ice sheets have caused sea level to rise by about 11 millimetres since 1992, which is towards the upper end of previous estimates. We look at the new study and what else is important for understanding sea level rise.
Scientists are interested in monitoring changes in the ice sheets because as they melt, water that was previously held on land is added to the ocean, causing sea levels to rise.
Scientists know that melting ice sheets are linked to rising global temperatures. But pinpointing how much melting ice sheets are contributing to sea level rise – and how they compare with other sources – is more difficult.
Satellites and sea level rise
Since the 1990s, scientists have used satellites to make more than 30 estimates of the volume of ice in both the Greenland and Antarctic ice sheets. But differences between the studies – like the type of satellite used and the duration of measurements – meant there was considerable disagreement, even over whether Antarctica was gaining or losing ice overall.
In the new study, scientists from the University of Leeds teamed up with the North American and European Space Agencies (NASA and ESA) to reconcile these differences. The researchers analysed 19 years of data from ten different satellite missions and by carefully matching up time periods and survey areas, they combined the data into one long time series.
Poles apart
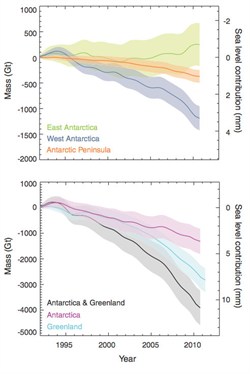
The data show that from 1992 to 2011, both ice sheets lost mass. Greenland lost more than 140 billion tonnes of ice per year and the rate of loss is now five times higher than it was in the 1990s.
Overall, Antarctica lost more than 70 billion tonnes of ice each year between 1992 and 2011, but not consistently all over. Western Antarctica and the Antarctic Peninsula both lost ice – 65 and 20 billion tonnes per year respectively – eastern Antarctica gained nearly 15 billion tonnes per year because of increased snowfall. Overall, the rate of loss has been slower than in Greenland, only showing a doubling since the 1990s.
Together, the ice sheets are losing more than three times as much ice now as they were in the 1990s. The rate has increased from 0.27 mm to 0.95 mm of sea level rise per year. Between 1992 and 2011, the ice sheets increased global mean sea level by just over 11 mm. This equates to 0.6 mm per year and close to 20 per cent of total sea level rise in that period.
Image - Shepherd _icesheet _mass _balance _total (note)
Top: Satellite measurements show that Western Antarctica and the Antarctic peninsula lost ice from 1993 to 2011, while East Antarctica gained ice. Bottom: The total amount of ice is decreasing, although much faster in Greenland than Antarctica. Source: Shepherd et al., (2012)
Refining estimates
Estimating ice loss using satellites is not perfect. Even though the scientists are confident that both ice sheets are shrinking, the exact amount of ice lost is still hard to pinpoint. For this reason, the estimated contribution to sea level rise comes with an uncertainty range of 0.2 mm per year, which means it could be as much as 0.8 mm or as little as 0.4 mm per year.
But combining data from several satellite missions increases the reliability of these results compared to previous studies, meaning there is less uncertainty now than there was.
In 2007, the Intergovernmental Panel on Climate Change (IPCC) estimated that between 1993 and 2003, melting ice sheets contributed about 0.42 mm per year to sea level rise with an estimated uncertainty range of about 0.35 mm per year either side.
So the new analysis – together with with several years more data – reduces the uncertainty and also suggests the contribution to sea level rise is towards the upper end of the IPCC’s estimates. The difference is important as even a few centimetres of sea level rise can flood vulnerable areas.
Other contributors
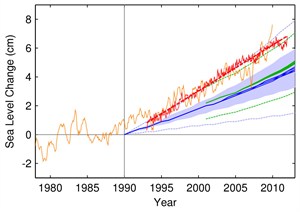
A recent study suggests that from 1993 to 2011, sea level rose by 3.2 mm per year. This is near the upper end of estimates given by the IPCC in 2001 and 2007.
Image - IPCC_se _level _rise _Predictionsvs Actual _Rahmstorf Et Al (2012) (note)
Sea level rise observed with satellites (red) and tide gauges (orange) between 1992 and 2011 exceed the best estimates given by the IPCC in the third (blue) and the fourth (green) assessment reports. Dashed lines represent the range of uncertainty. Source: Rahmsorf et al., (2012)
So if melting ice sheets were responsible for roughly 20 per cent of sea level rise between 1992 and 2011, what caused the other 80 per cent?
Most of the remaining sea level rise is down to the fact that as water warms, it expands – increasing the volume of the ocean. Scientists also need to take into account how much melting mountain glaciers and small ice caps contribute to sea level rise. Recent research suggests that scientists are finding better ways to measure this relationship, too, by looking at shrub growth patterns to estimate past changes in ice cover.
Together with the new study on ice sheet melt, scientists are getting a better idea of the how the sources of sea level rise are changing. As the new study shows, the rate of ice sheet melt has accelerated in recent years. The researchers say this means the contribution from the ice sheets could have risen to 30 or 40 per cent. Another recent paper suggests that if the rate of acceleration continues, ice sheets will be the dominant contributor to sea level rise in the 21st century.
The future?
The new study looked at past data and, as such, does not try to predict future sea level rise. Predictions are based on a lot more information, such as how emissions are likely to change. This means these results cannot simply be extended into the future.
Nevertheless, this study is helpful in refining scientists’ understanding of how the ice sheets have responded to recent warming. And importantly, this study has been published in time to feed into the climate models that the IPCC will use in the next round of climate predictions – including sea level rise – due next year.