Guest post: Tracking the unprecedented impact of humans on the climate
Our new scientific assessment of how humans are affecting the climate is nothing short of alarming, yet it does contain some encouraging news.
The second “Indicators of Global Climate Change” report, published in Earth System Science Data, provides an annual update on a set of metrics originally assessed by the Intergovernmental Panel on Climate Change (IPCC).
With the latest IPCC assessment report on climate science completed in 2021 and the next one not expected until at least 2027, there is a substantial gap to fill.
This is crucial at a time when human activity is changing the climate system at a rate and scale not experienced since records began.
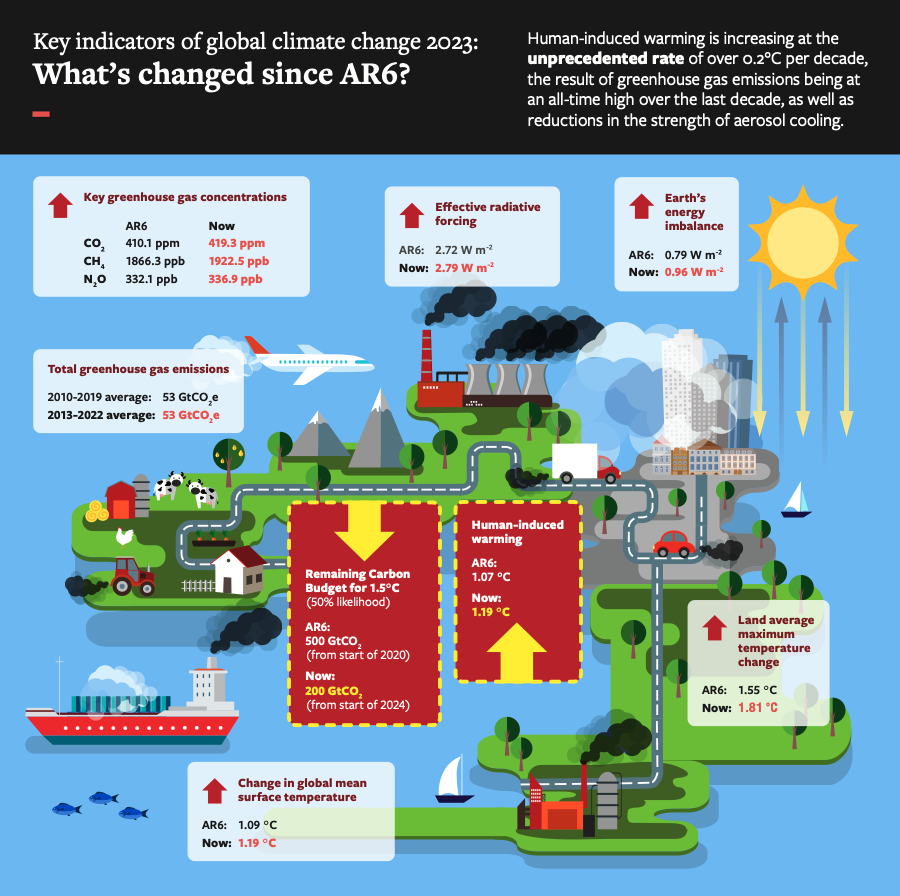
For 2023, which smashed the record for the warmest year, our best estimate of the warming caused by human activity is 1.31C above pre-industrial levels.
This is the first year where this estimate has reached the 1.3C threshold. Our report also shows that human-caused warming has been increasing at a rate of 0.26C per decade.
This high rate of warming is caused by a combination of greenhouse gas emissions being close to an all-time high and a reduction in the cooling impacts of aerosols as society tackles deadly air pollution.
Yet, there is some positive news: greenhouse gas emissions have not yet risen beyond pre-pandemic levels and there is evidence that the rate of increase in CO2 emissions over the past decade has slowed compared to the 2000s.
§ Tracking climate change
We track and document how datasets and methods evolve between IPCC report cycles. The aim is to increase transparency and consistency from one cycle to the next, as well as filling the gap between reports.
This takes an international team of more than 50 scientists, including former IPCC authors and curators of global datasets.
The work builds a chain of evidence from emissions to temperature change, bringing around 20 global datasets together, to make a consistent estimate of human-caused warming based on the best-available current data and science.
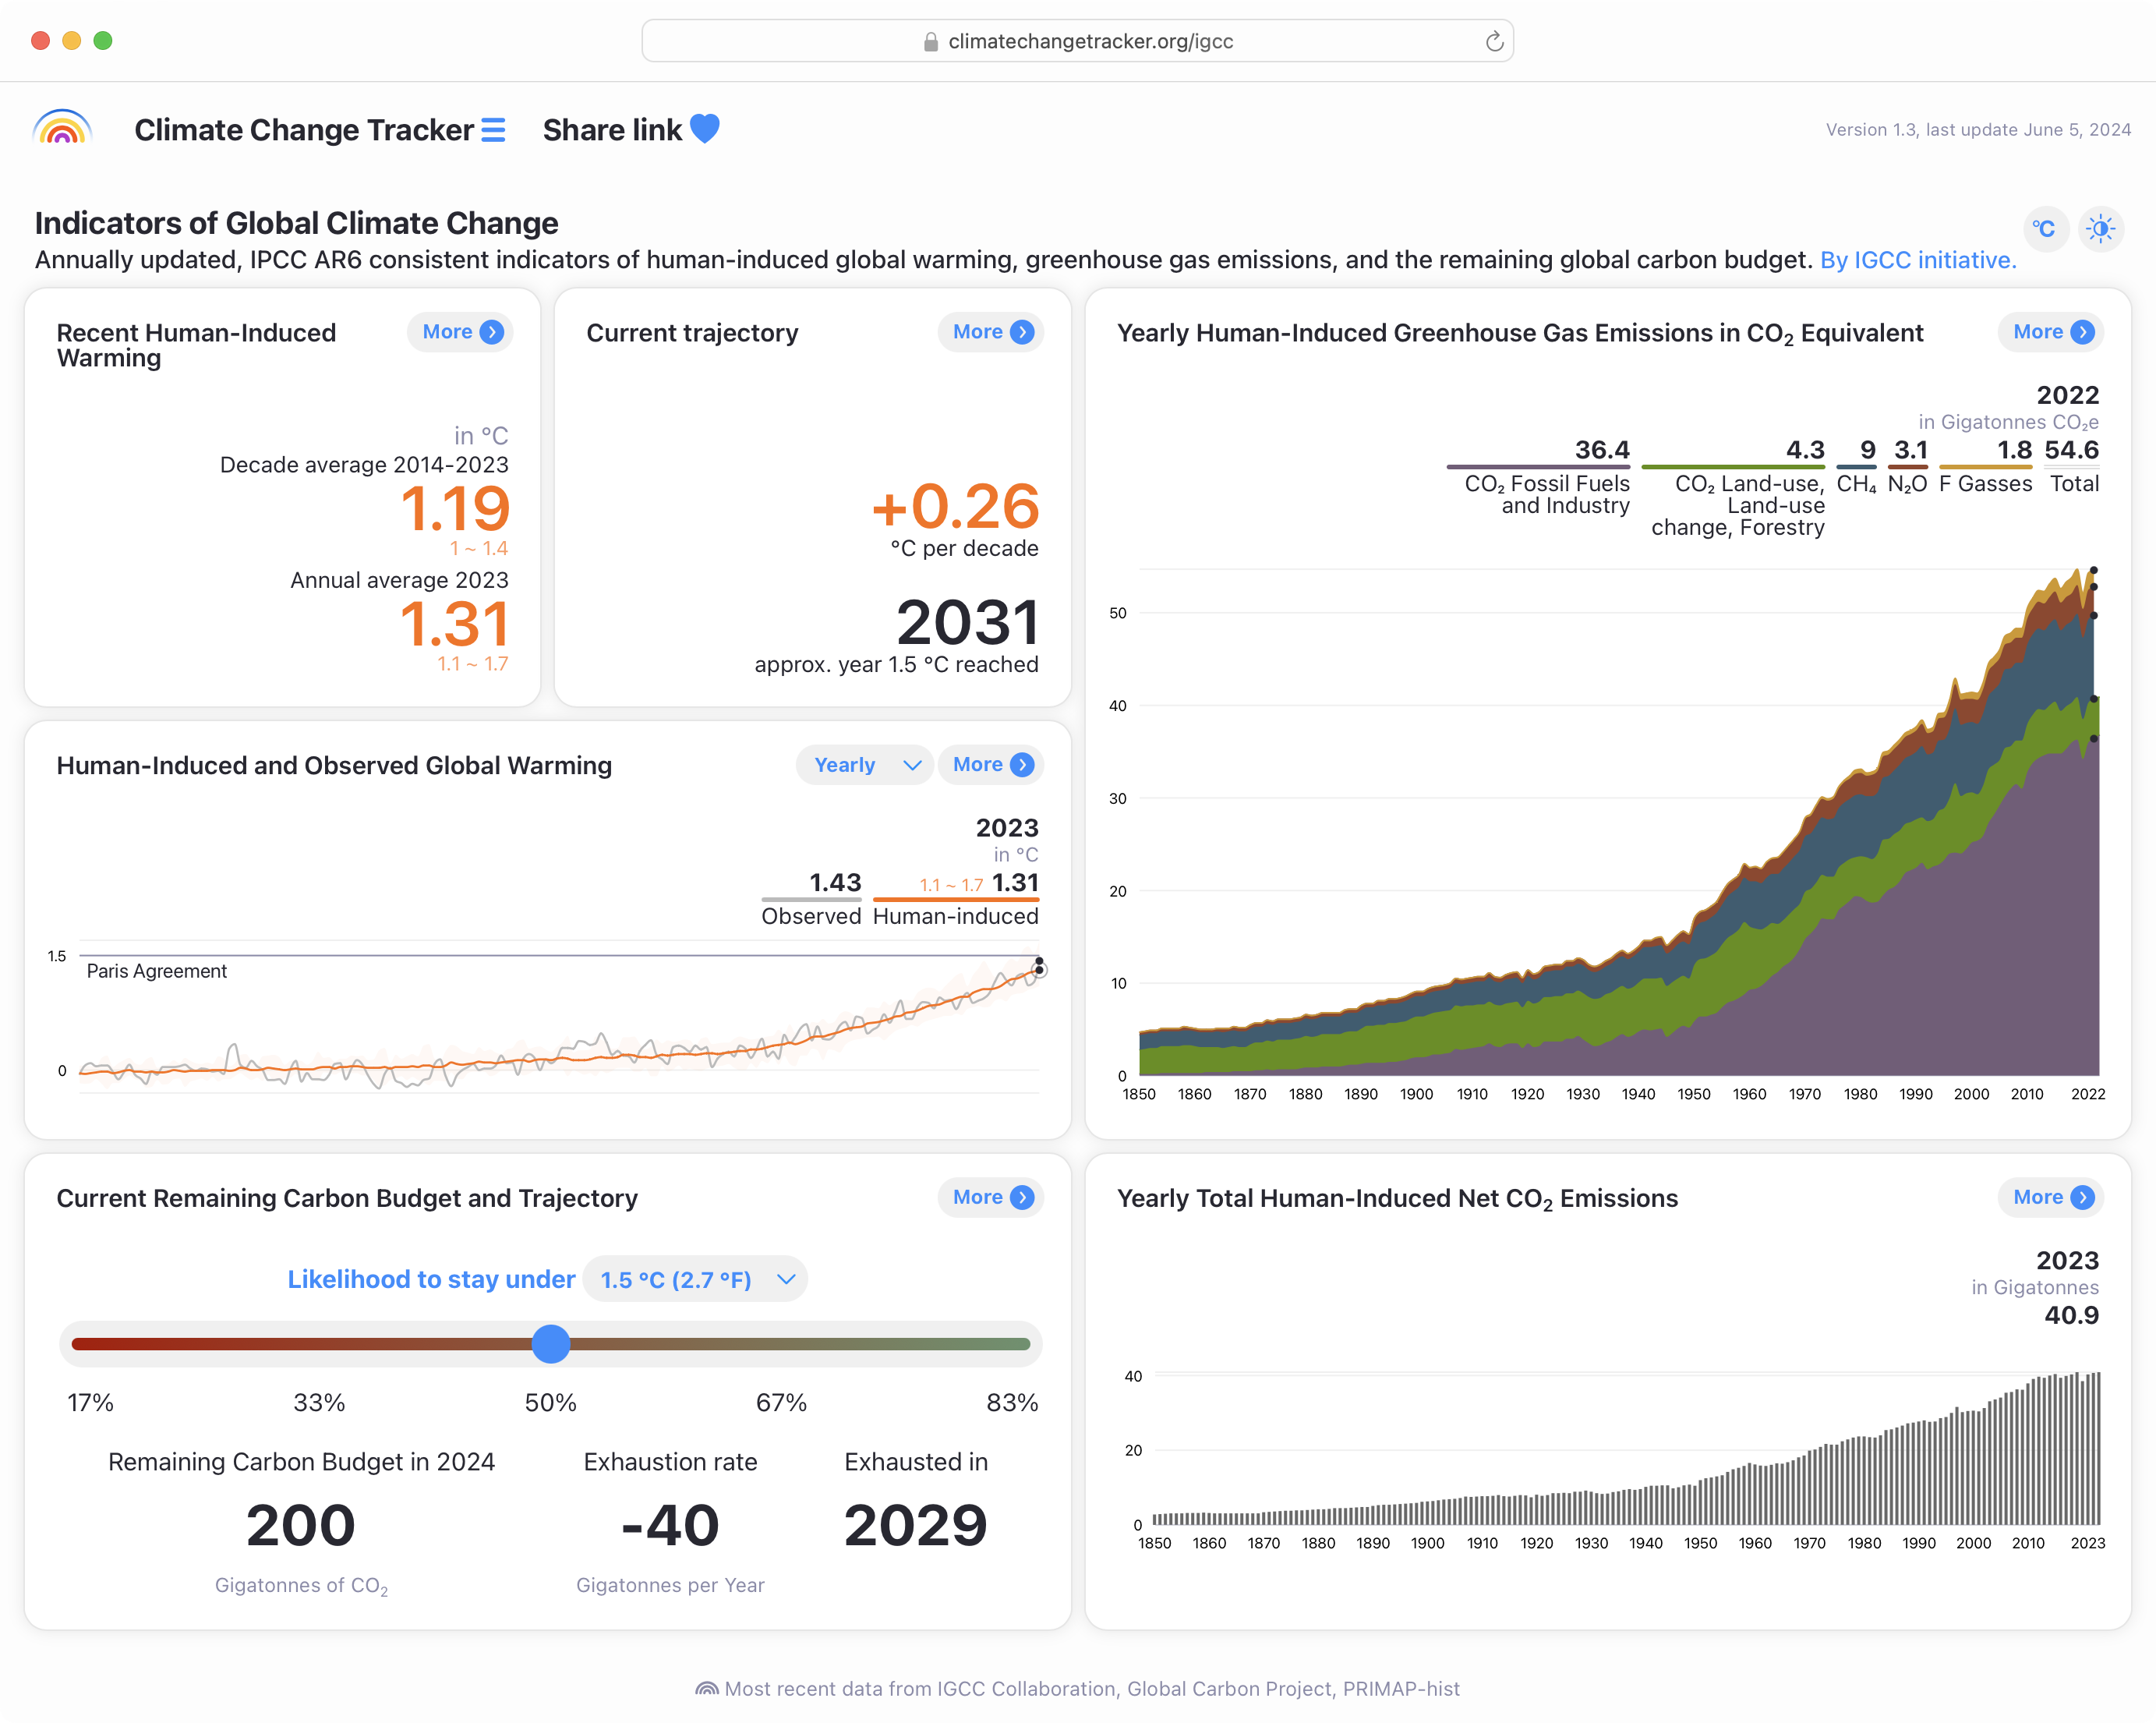
The data and their changes are displayed on a dedicated Climate Change Tracker platform, shown below.
§ Greenhouse gas emissions
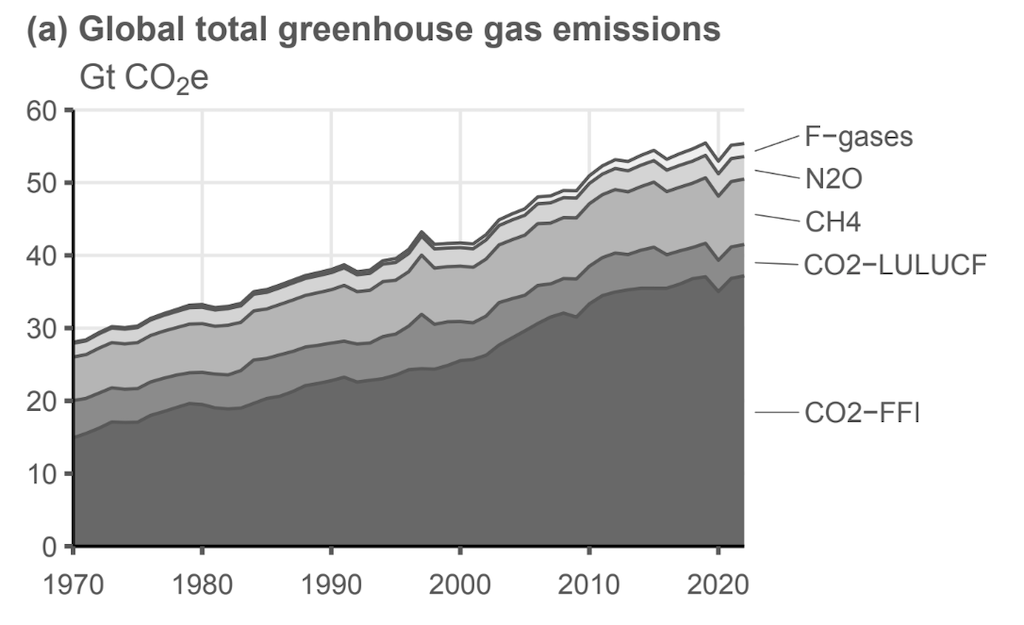
The starting point for updating the indicators is data on greenhouse gas (GHG) emissions. The most recent decade we have data for (2013-22) shows that average global GHG emissions were equivalent to 53bn tonnes of CO2 (GtCO2) per year.
Total GHG emissions remain ever so slightly below the pre-pandemic high set in 2019, as the chart below illustrates.
With emissions rebounding in the wake of the Covid-induced lockdowns around the world, it is too early to say whether GHG levels have already peaked. For example, both CO2 emissions from coal and gas and emissions of non-CO2 gases are rising. Emissions from oil are also increasing again, but remain below pre-pandemic levels.
These growing emissions have been offset by a small decline in land-use emissions.
With the high levels of ongoing emissions, GHGs have continued to build up in the atmosphere. These in turn affect the heat gained by the Earth system, which is increasing its effective radiative forcing (ERF).
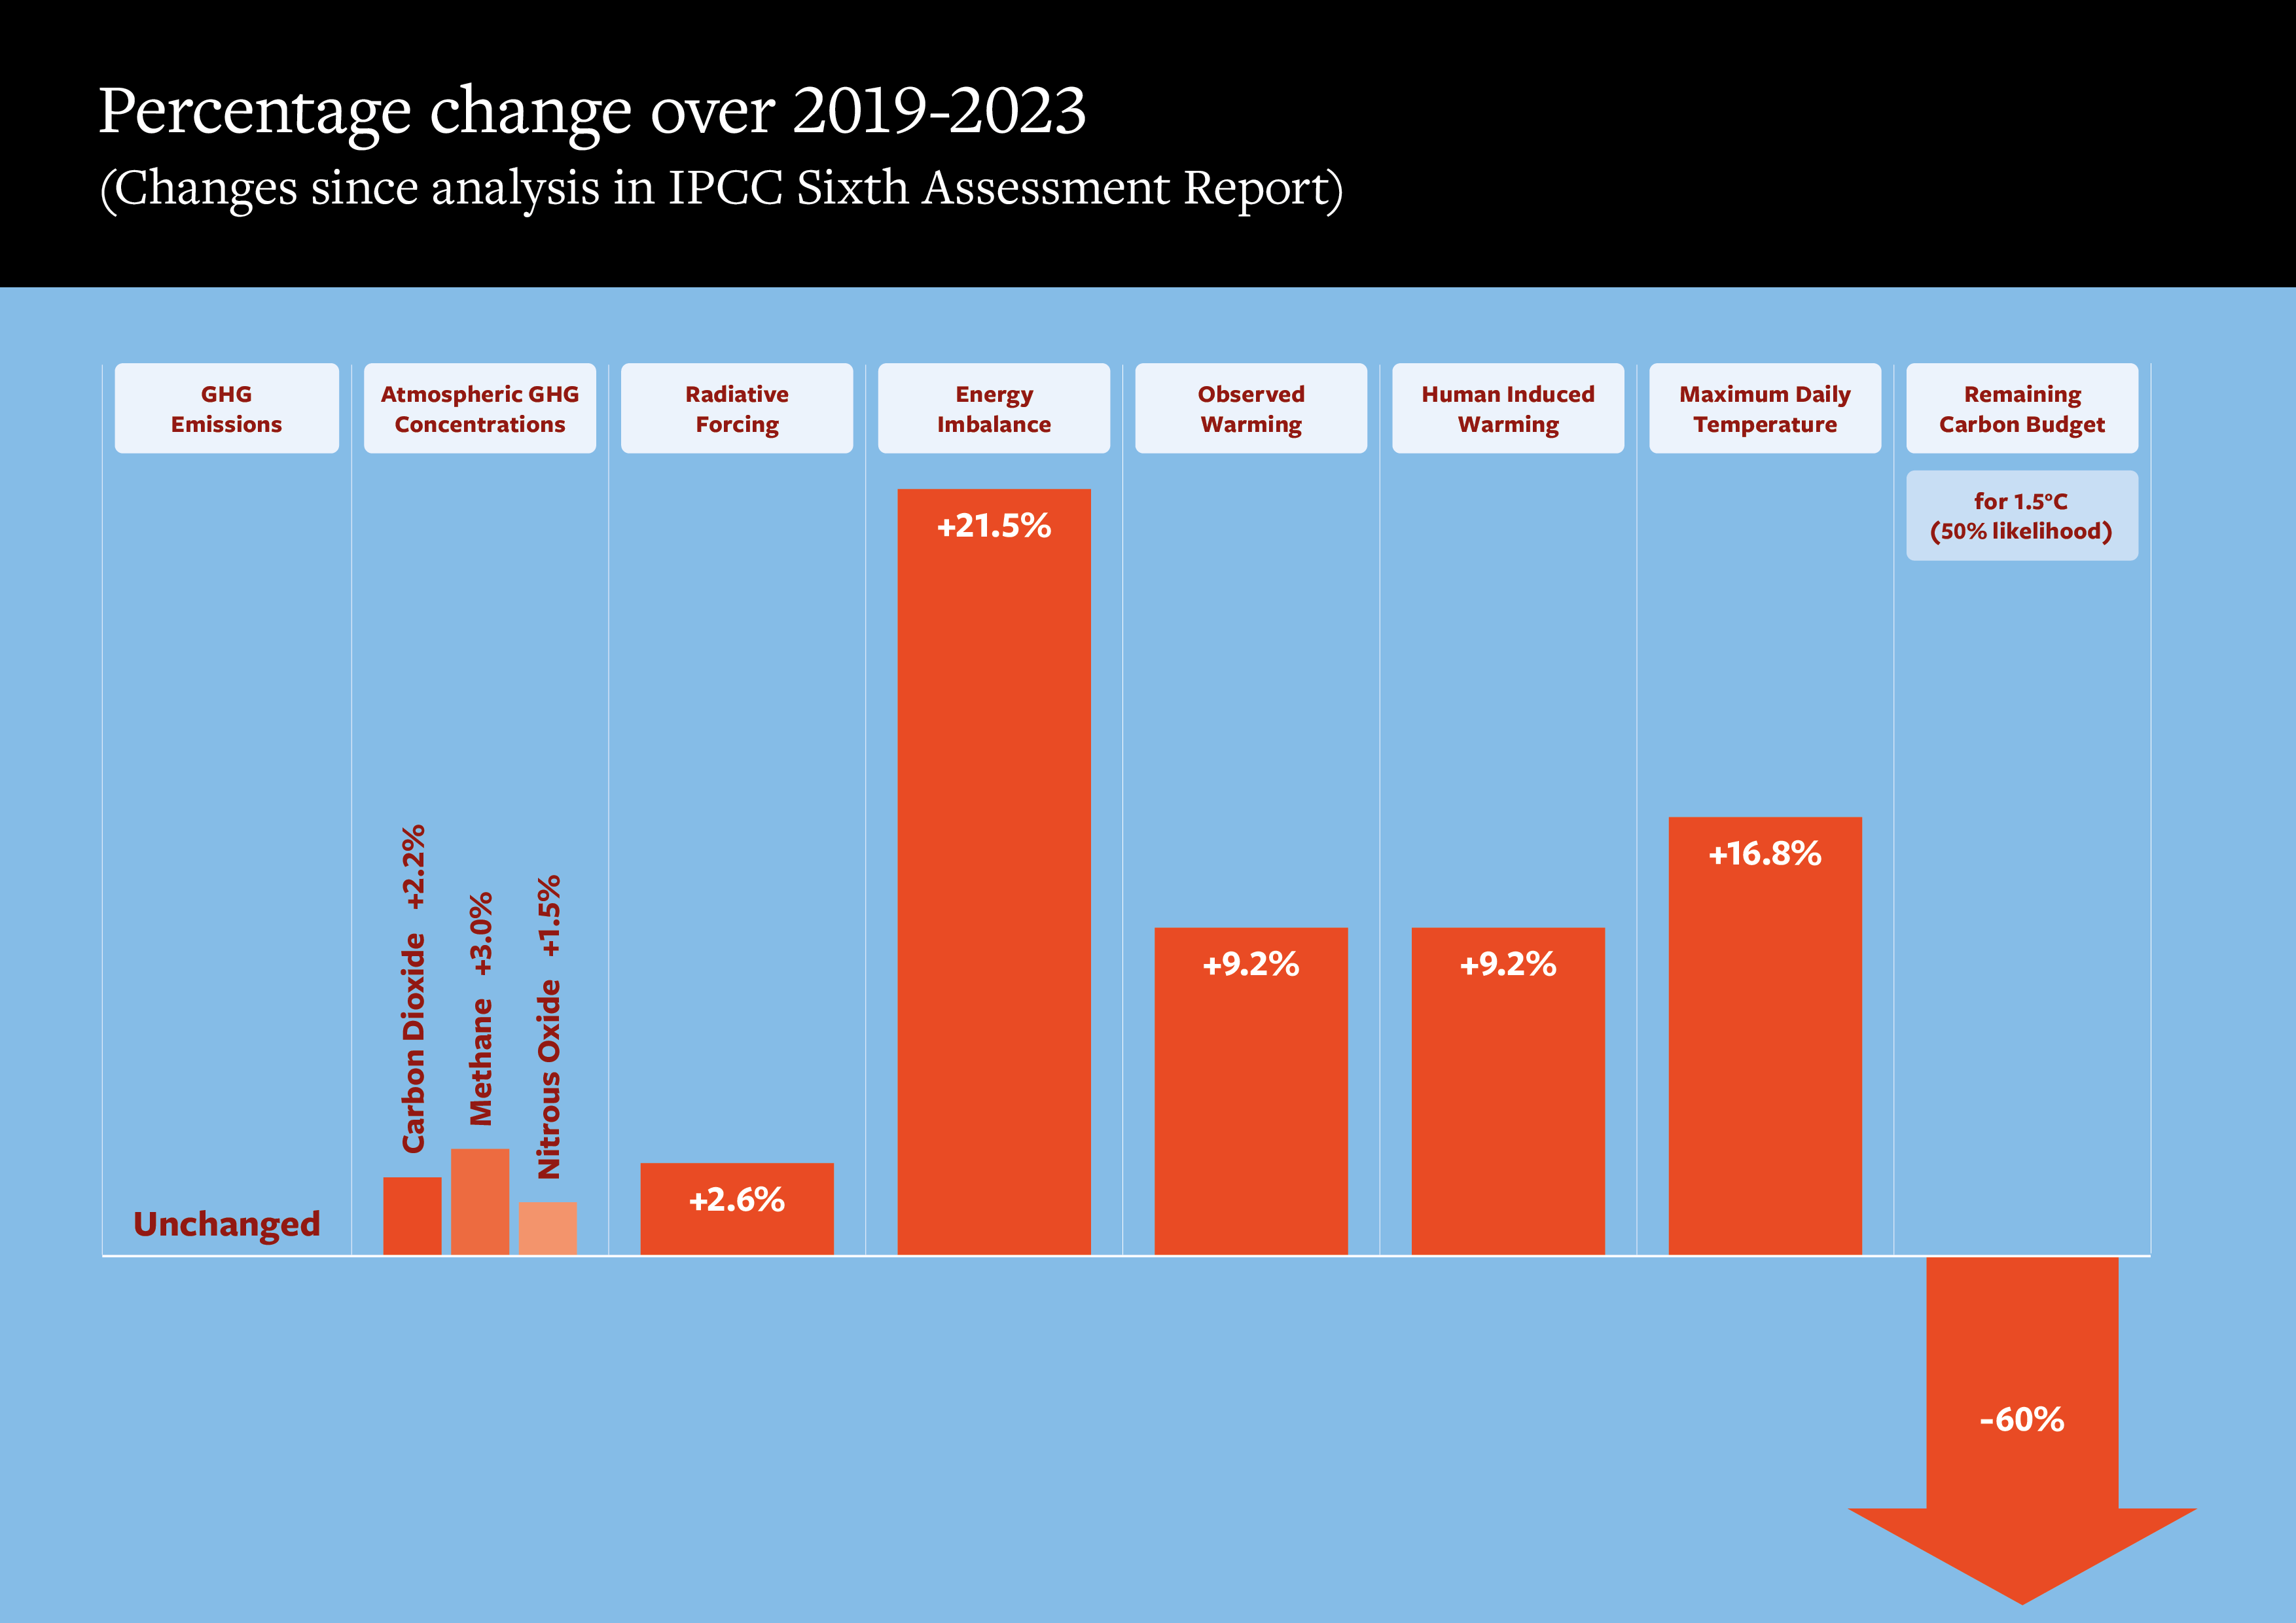
ERF resulting from human activity rose to 2.79 watts per metre squared (W/m2) in 2023, compared to 2.72 W/m2 in 2019. However, last year’s ERF is lower than 2022’s (2.91 W/m2), mainly because of the increase in aerosols from wildfires in 2023, which had a cooling effect. In 2023, the increased aerosols from wildfires more than compensated for the ongoing fall in sulphur emissions from shipping and other sources. (See sections below for more detail.)
§ Warming impact
High GHG emission levels are also affecting the Earth’s energy balance, with observations showing an increase in the rate of heating on land and in oceans. Satellites and ocean buoys are tracking unprecedented flows of heat into the Earth’s oceans, ice caps, soils and atmosphere.
This rate of heat flow has doubled from the levels seen in the 1970s and 1980s to 0.96W/m2 measured over 2011 to 2023. This means nearly 1W/m2 of additional heat is flowing into every square metre of the Earth surface, 24 hours a day, 365 days per year.
Human-caused global warming has also increased by 0.1C in the four-year gap in tracking since the last IPCC report.
§ Remaining carbon budget
Our publication also reassesses the remaining carbon budget – the amount of CO2 that can be emitted while still keeping global warming below a certain level.
In 2020, the remaining carbon budget for a 50% likelihood of staying below 1.5C was around 500GtCO2, with an uncertainty range of 300-900GtCO2. At current emissions rates, that would be exhausted within around 12 years.
Since then, CO2 emissions and global warming have continued. At the start of this year, the same budget stood at 200GtCO2, with a range of 100-450GtCO2. This would be blown within less than five years at current rates.
The remaining carbon budget is also impacted by future non-CO2 emissions such as methane, as well as the cooling effects of aerosols such as sulphates. With non-CO2 emissions expected to contribute to warming going forward, the carbon budget also accounts for their predicted warming effect.
In this future scenario, we also assume methane and nitrous oxide emissions decline; if they do not, the carbon budget will be even smaller.
§ Record warmth in 2023
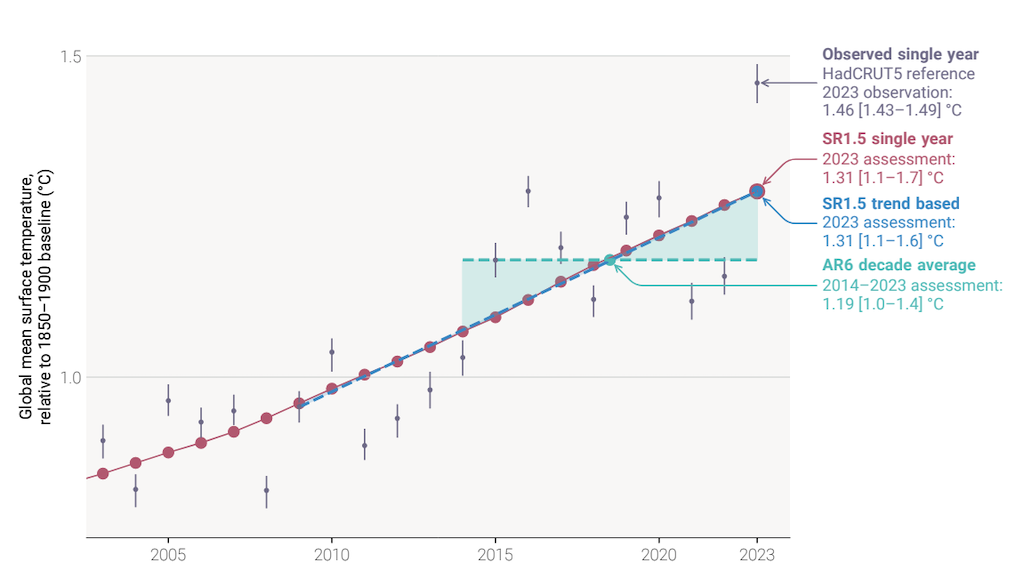
Last year saw a large increase in global temperatures, approaching 1.5C above pre-industrial levels in some datasets and reaching 1.43C in the average of four datasets used in the IPCC report.
Seeing 1.5C total warming during one year – or even more than one – does not mean that the Paris Agreement has been breached, nor does reaching or exceeding 1.5C warming in a particular month or location.
The Paris Agreement’s long-term temperature goal reflects global, human-caused, long-term temperature change that excludes short-term natural variability in the climate system. However, higher and rising annual temperatures clearly mean that we are heading in the wrong direction.
Our indicators show that, for the 2014-23 decade, observed global warming was 1.19C, of which 1.19C – that is, 100% – was caused by human emissions.
This is shown in the chart below, which compares the estimated human contribution to warming in individual years (grey) with assessments for 2023 (red), the trend in 2023 (blue) and the 2014-23 decadal average (green).
For the individual year of 2023, humans were responsible for 1.31C of the 1.43C that was recorded globally. This means that there was a substantial contribution from other causes to the record temperatures of 2023.
§ Contributing factors
The reasons for the record warm 2023 are still being investigated – for example, they could include shipping emission reductions (see below) as well as natural factors, such as the climate phenomenon El Niño.
Sometimes these factors are not easily distinguished as human or natural. For example, growing forest fires and their impact on emissions and the climate system.
Last year, Canada experienced its most severe fire season of the modern era, while there were also catastrophic fires in Hawaii, the Mediterranean, central Amazonia and central Chile.
Establishing how much of this biomass burning, the resulting emissions of aerosols and their effect on the climate is from natural wildfires is not easy.
For example, if the wildfires were caused by higher temperatures, themselves caused by human activity, this would be a climate feedback rather than from direct human activity.
This is an area where development of a consistent approach across datasets is needed. The same goes for methane, where emissions are primarily from fossil fuel production, agriculture and waste. Yet, emissions are also increasing from tropical wetlands under a warming climate.
There has been a lot of interest in how sulphur regulations from shipping led to a rapid fall in sulphur dioxide emissions in 2020 and possibly contributed to high global temperatures in 2023.
Our paper makes a preliminary investigation of its climate impact and we find that the global radiative forcing effect of the declining emissions would likely only have had a minor role in the high 2023 global temperatures.
We estimate that, globally, the cooling effect of the aerosols from the fires in Canada likely dominated any warming effect from shipping emission regulation changes.
§ Next steps
As 2024 unfolds, we hope that the indicators can shed further light on how human activity is shaping our climate at rates and levels not previously seen.
The aim is that they help lay the groundwork for the level of ambition needed for the latest national pledges under the Paris Agreement – the 2035 nationally determined contribution (NDC) commitments – where we expect countries to put more ambitious targets forward to the UN Framework Convention on Climate Change (UNFCCC) by 2025.
Perhaps our next update, which will be delivered to the Bonn negotiations in 2025, will begin to track a change in direction for the climate system that reflects a realisation of stronger and ambitious climate action for the longer-term.