Agriculture ‘major driver’ of rise in nitrous oxide emissions over past 40 years
Nitrogen fertilisers, manure and other agricultural sources drove almost three-quarters of human-caused nitrous oxide emissions in recent years.
That is according to the Global Carbon Project’s second “global nitrogen budget” – an assessment of the origins and climate impacts of the world’s nitrous oxide emissions.
The research, published in Earth System Science Data, finds that nitrous oxide emissions from human activities rose by 40% over the past four decades, partly driven by growing global demand for meat and dairy.
Nitrous oxide emissions over the past decade exceeded even the highest projected levels in emissions pathways, the research finds.
Continuing to emit the greenhouse gas at current rates would “really affect” the world’s ability to achieve the long-term goal of the Paris Agreement to limit global warming to “well below” 2C, the lead author of the study tells Carbon Brief.
One expert, who was not involved in the research, says the findings show “all too clearly” that nitrous oxide emissions “are still going rapidly in the wrong direction”.
§ Potent greenhouse gas
Nitrous oxide (N2O) is a long-lasting greenhouse gas that is around 270 times more potent than CO2. It is the third-largest contributor to climate change, after CO2 and methane.
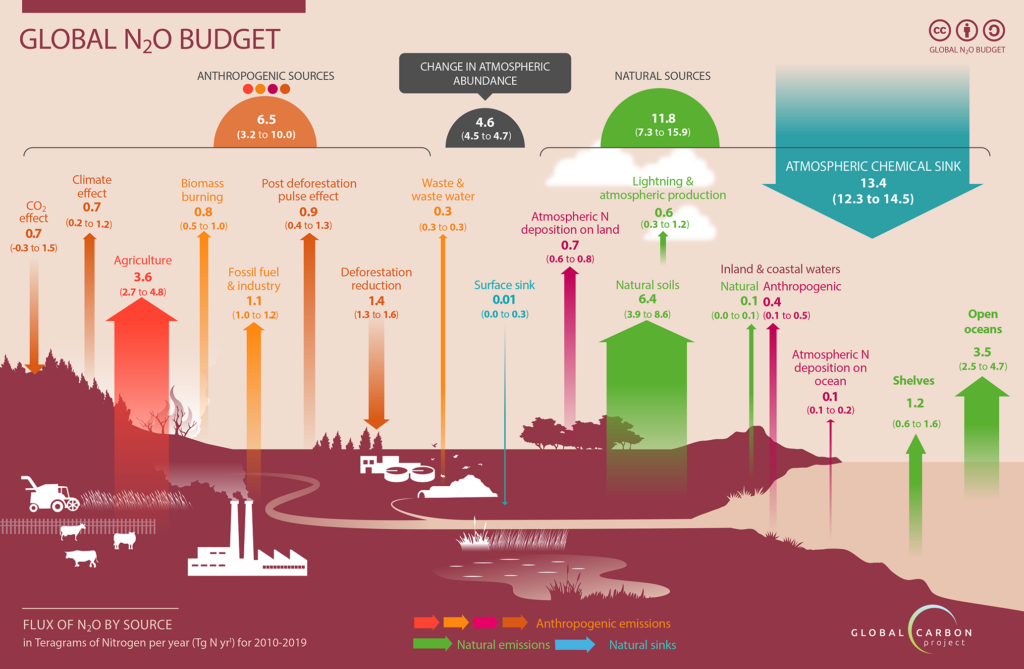
Various natural sources generate nitrous oxide, including tiny organisms in the world’s oceans and soils. These natural emitters accounted for 65% of all nitrous oxide emissions over 2010-19.
Human activities caused the remaining 35% of emissions, particularly nitrogen fertiliser use and manure management in agriculture. The burning of fossil fuels and biomass also produce nitrous oxide, but to a lesser extent.
The new study assesses both natural and human-caused sources of nitrous oxide to see how they have changed over time and how they are contributing to climate change.
It divides the sources and sinks into 21 categories, such as direct emissions from nitrogen use in agriculture and the exchange of CO2 between the land and atmosphere .
The researchers use a range of satellite data, models, algorithms and inventories to assess emissions over time.
The study finds that human-caused nitrous oxide emissions “significantly increased” from 1980 to 2020, growing by 40% during this time period. This rise was spurred on, in part, by growing demand for meat and dairy.
This is a jump of 10% in these human-caused emissions from the last nitrous oxide assessment, which covered data over 1980-2016.
However, the new study includes more categories than the previous global assessment, including emissions from microbe activity in the shallow waters over continental shelves. The researchers in the study say this explains some of the higher estimates in the new report.
Concentrations of the greenhouse gas in the atmosphere have also risen faster in the past three years than any other time since 1980.
Prof Hanqin Tian is the lead author of the study and an environmental sciences professor at Boston College. He tells Carbon Brief that nitrous oxide emissions continuing at current rates would “really affect the Paris climate agreement” goals.
Natural nitrous oxide emissions, on the other hand, were “relatively stable” over the period covered by the research. Tian explains:
“In terms of the total number, natural emissions are very high. But over long time periods, they stay stable. So natural emissions do not really contribute to climate change from pre-industrial times to now.”
Human-caused emissions have increased significantly. The below infographic outlines the changes in different nitrous oxide emissions sources from 2010 to 2019.
Prof Dave Reay, the chair in carbon management and education at the University of Edinburgh, who was not involved in the study, says that the research is “really significant” for both scientists and policymakers. He tells Carbon Brief:
“Nitrous oxide’s importance can sometimes be obscured by the larger climate forcing effects of CO2 and methane, yet every missed opportunity to cut nitrous oxide emissions drags the world still further away from achieving the Paris climate goals.”
The researchers highlight that human-caused nitrous oxide emissions need to be cut by at least one-fifth by 2050 to help limit long-term warming to 2C, according to the Intergovernmental Panel on Climate Change (IPCC).
Reay says this study shows “all too clearly” that these emissions are “still going rapidly in the wrong direction”.
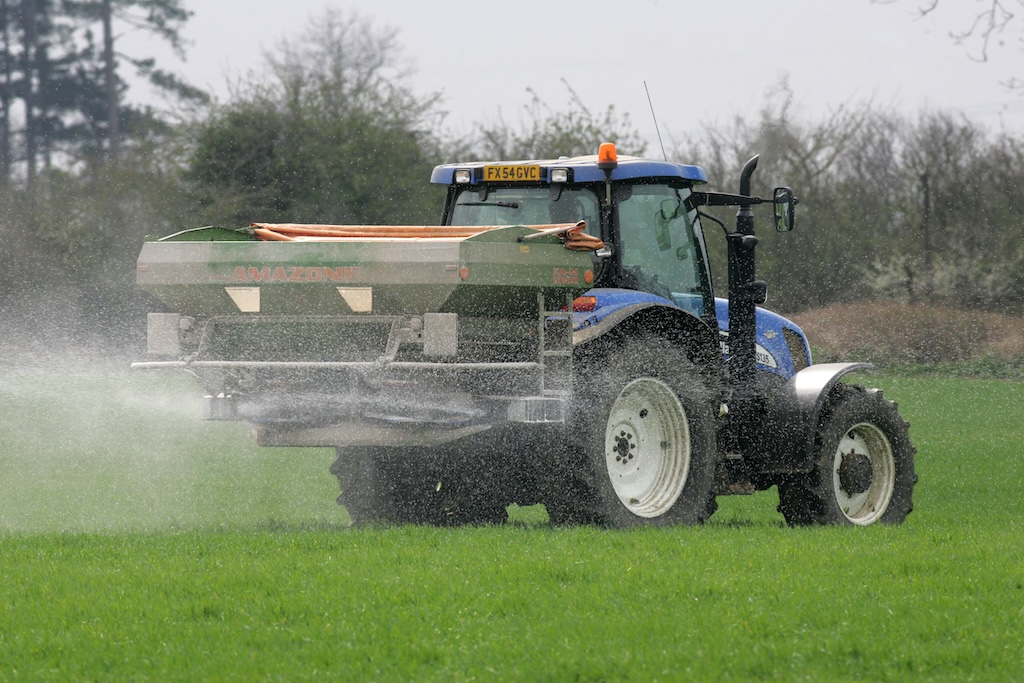
§ Agricultural emissions
Agriculture was the “major driver” of increased human-caused nitrous oxide emissions over the past four decades, the study says. In total, the researchers find that the sector was responsible for 74% of these emissions over 2010-19.
While agricultural emissions increased over time, other human-caused nitrous oxide emissions from fossil fuels and industry decreased slightly between 1980 and 2020.
Cutting nitrogen use in agriculture is a “quite complex issue related to food production, food security” and a range of other issues, Tian says.
Requirements to cut nitrous oxide emissions, particularly from livestock, have been a major political issue in the Netherlands and other countries. Nitrous oxide emissions are “expected to continue rising” over the next few decades due to the growing demand for food, the study says.
Reay says that reducing nitrogen use in agriculture “can yield benefits not just for climate change mitigation, but for food production, air and water quality and biodiversity, too”. He adds:
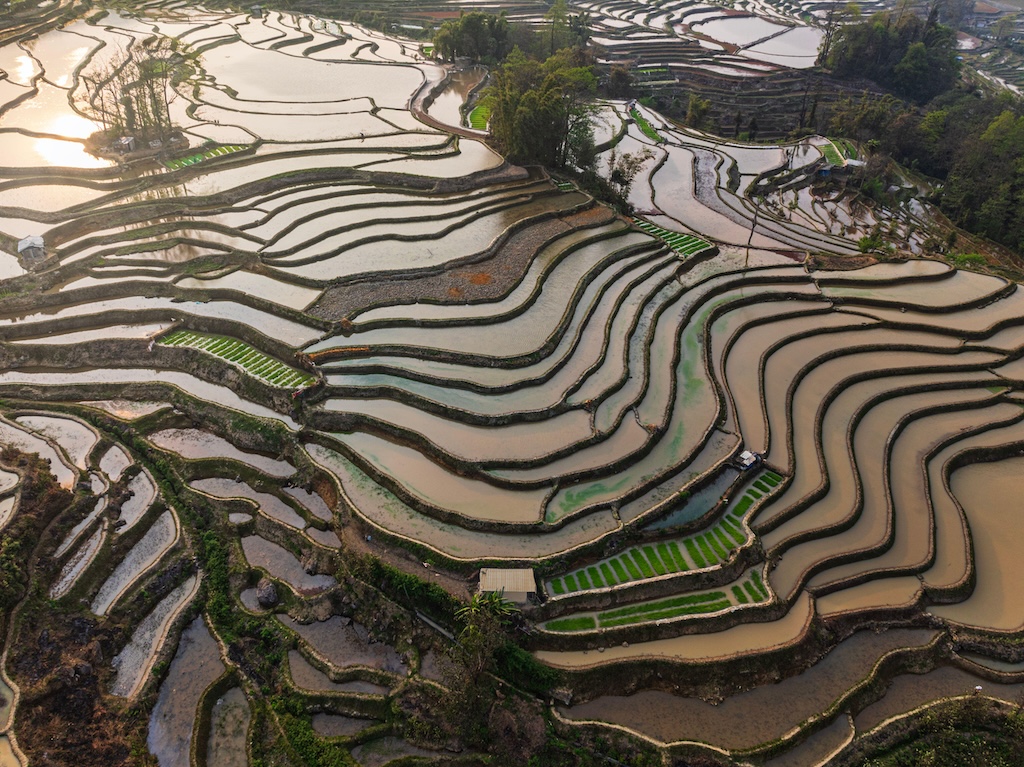
“The array of strategies to address these losses – primarily through improving so-called nitrogen use efficiency across our food systems – are already showing positive results in some areas of Europe and south-east Asia.”
An excess of nitrogen used on the land can wash into lakes, rivers and oceans. This run-off causes damage to plants, animals and humans and spurs on toxic algae. Nitrous oxide also contributes to depletion of the ozone layer.
§ Top-emitting countries
The study also examines emissions in 18 different regions, finding that they grew in some countries and decreased in others over the past four decades.
China, India, the US, Brazil and Russia were the five biggest nitrous oxide emitters in 2020, the study findings show.
Human-caused emissions increased by 157% in India, 135% in China and 131% in Brazil over 1980-2020.
China alone made up 40% of the overall increase in global human-caused nitrous oxide emissions between 1980 and 2020.
Although the country remains the biggest emitter, China’s nitrous oxide emissions have decreased in recent years as a result of efforts to use nitrogen fertilisers more efficiently, Tian says.
Nitrous oxide emissions have reduced in several parts of the world since 1980: Europe, Russia, Australia, New Zealand, Japan and Korea.
Europe – the biggest nitrous oxide emitter in 1980 – has seen the most significant drop in the four decades since. Emissions fell by one-third (31%) during this time, largely due to fossil fuel and industry emissions cuts in the 1990s.
Agriculture-related nitrous oxide emissions also decreased in Europe during this time, but the drop has levelled off since the 2000s, the study notes.
§ Exceeding future projections
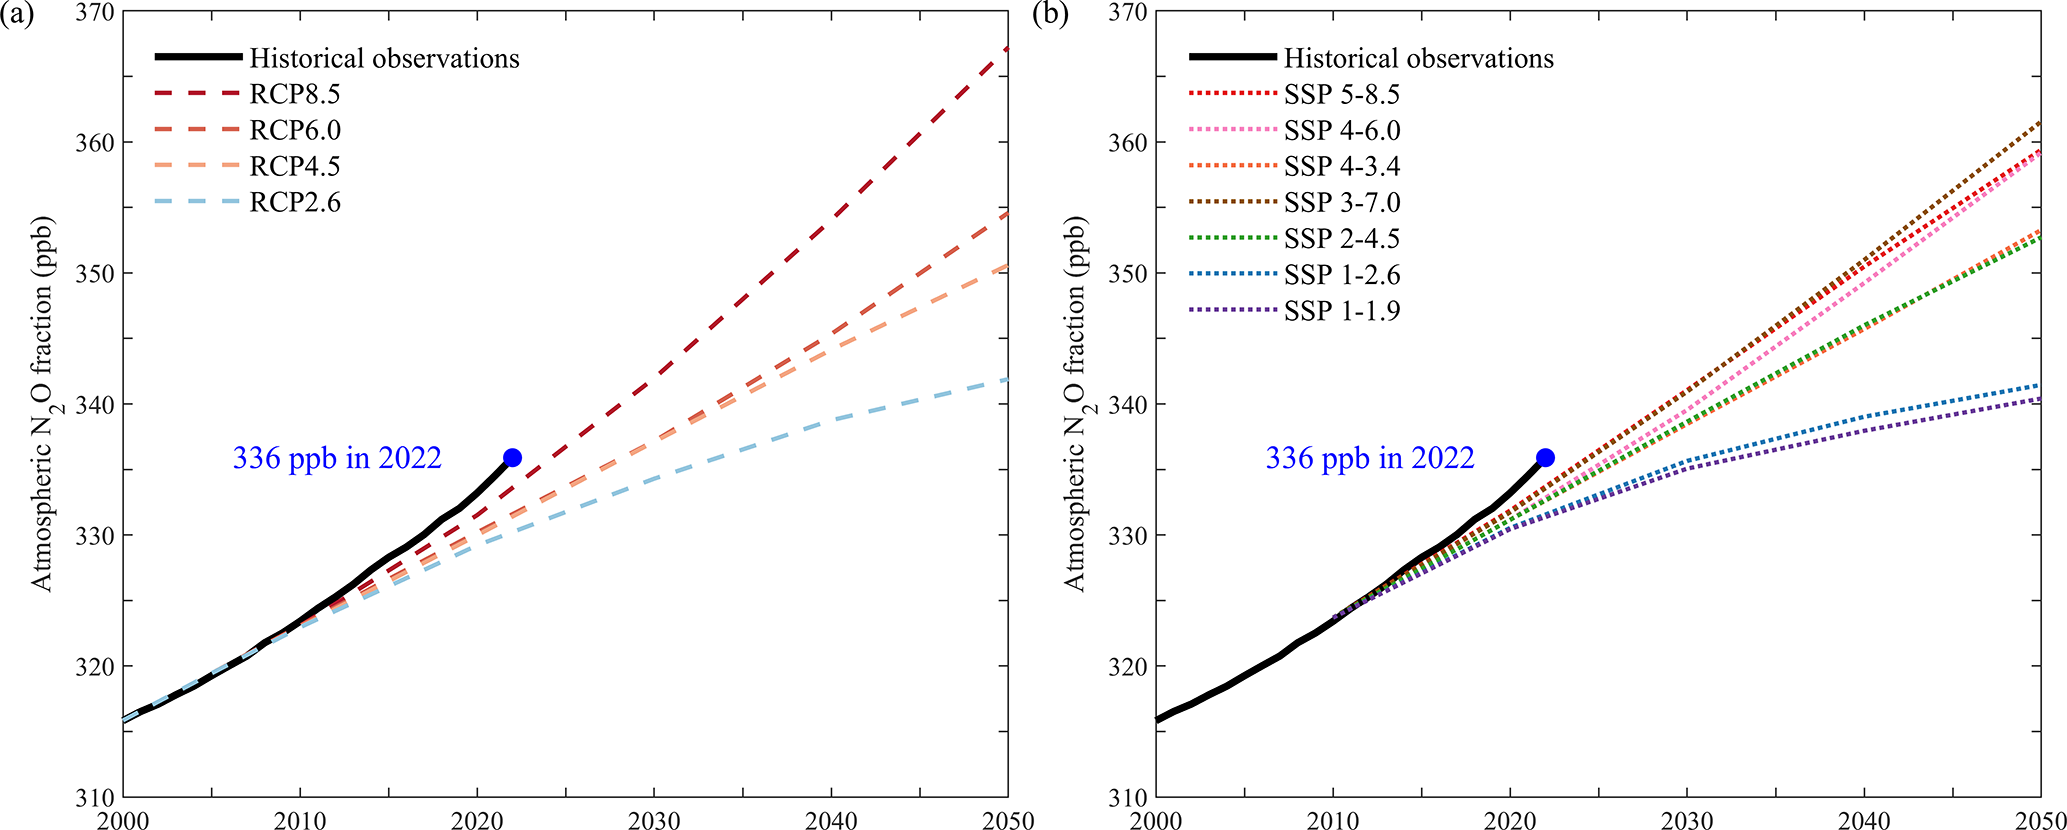
The scientists also explore how current nitrous oxide emissions compare with those from scenarios of future projections of climate change.
The charts below show how global nitrous oxide concentrations in the atmosphere (black line) compare with projections under the “Representative Concentration Pathways” (RCPs, left) and the “Shared Socioeconomic Pathways” (SSPs, right).
The charts highlight that atmospheric concentrations of the greenhouse gas over the past decade have exceeded even the projections under the very-high-emissions trajectory, RCP8.5 (red dashed line).
The researchers outline some “major uncertainties” with their findings and the scientific understanding of where nitrous oxide comes from.
These include the understanding of emissions from soils in tropical ecosystems in the Amazon Basin, the Congo Basin and south-east Asia, alongside areas using high levels of fertilisers, such as the US “corn belt”.
The study also mentions uncertainties around estimates for the impact of deforestation on nitrous oxide emissions.
The researchers propose setting up a global network to better monitor and model nitrous oxide emissions. Reay says that this is a “very timely suggestion”, adding:
“With all nations needing to submit their updated national plans for climate action in the run up to COP30 in Brazil next year, better measurement of nitrous oxide emissions holds the promise of better reporting and, crucially, better efforts to cut them.”