Analysis: Conservative election win could add 800m tonnes to Canada’s emissions by 2035
A Conservative victory over the Liberals in the Canadian election could lead to nearly 800m extra tonnes of greenhouse gas emissions over the next decade, according to Carbon Brief analysis.
This amounts to the entire annual emissions of the UK and France combined.
These extra emissions would cause around C$233bn ($169bn) in climate damages around the world, based on the Canadian government’s official costings.
The right-leaning Conservative party, led by Pierre Poilievre, has pledged to cut one of the nation’s most significant climate policies – industrial carbon pricing – as well as other key regulations.
If these policies are removed and not replaced, modelling by researchers from Simon Fraser University and University of Victoria shows that Canada’s gradually declining emissions would likely start to creep up again in the coming years.
In contrast, emissions would continue to fall under the policies currently backed by Mark Carney’s centrist Liberal party, which has overseen a modest decrease over the past decade.
However, Carbon Brief analysis of the modelling also suggests that neither of the major parties’ policy platforms would put Canada on track to reach any of its climate targets.
These figures complement analysis by the Canadian government showing that the nation still needs to implement more ambitious measures in order to reach its target to cut emissions to net-zero by 2050.
(For more on Canada’s election, see Carbon Brief’s manifesto tracker, which captures what the major parties have said about climate change, energy and nature.)
§ Conservatives could raise emissions
Canada is the world’s 10th biggest emitter of greenhouse gases. Significant contributors include its sizeable oil-and-gas sector and high emissions from transport.
The nation has been relatively slow to decarbonise. However, after a decade of rule by the Liberals, led by prime minister Justin Trudeau, there has been a small dip in Canada’s emissions.
With a federal election looming, an unpopular Trudeau resigned and was replaced in March by Carney, an economist with a background in climate finance.
His main rival in the election, which takes place on 28 April, will be the Conservatives, a party that until recently was the clear favourite. Conservative leader Poilievre has accused the Liberal government of pursuing “net-zero environmental extremism” and Carney of being part of the “radical net-zero movement”.
A sudden shift in polling that put the Liberals ahead has been widely attributed to their right-leaning opponents’ alignment with Donald Trump. This alignment has become politically toxic, following the US president’s tariffs and talk of annexing Canada.
Carbon pricing is at the heart of Canadian climate politics. Poilievre has long pledged to “axe the tax”, referring to a consumer levy that is meant to incentivise people to use less fossil fuel.
When Carney took office, his first action was to cut this carbon tax to zero, effectively ending his party’s signature climate policy.
In response, Poilievre pledged to cut the “entire carbon tax”, referring to a federal backstop on carbon pricing applied to major industrial emitters, such as fossil-fuel producers. He has also committed to abandoning other climate regulations.
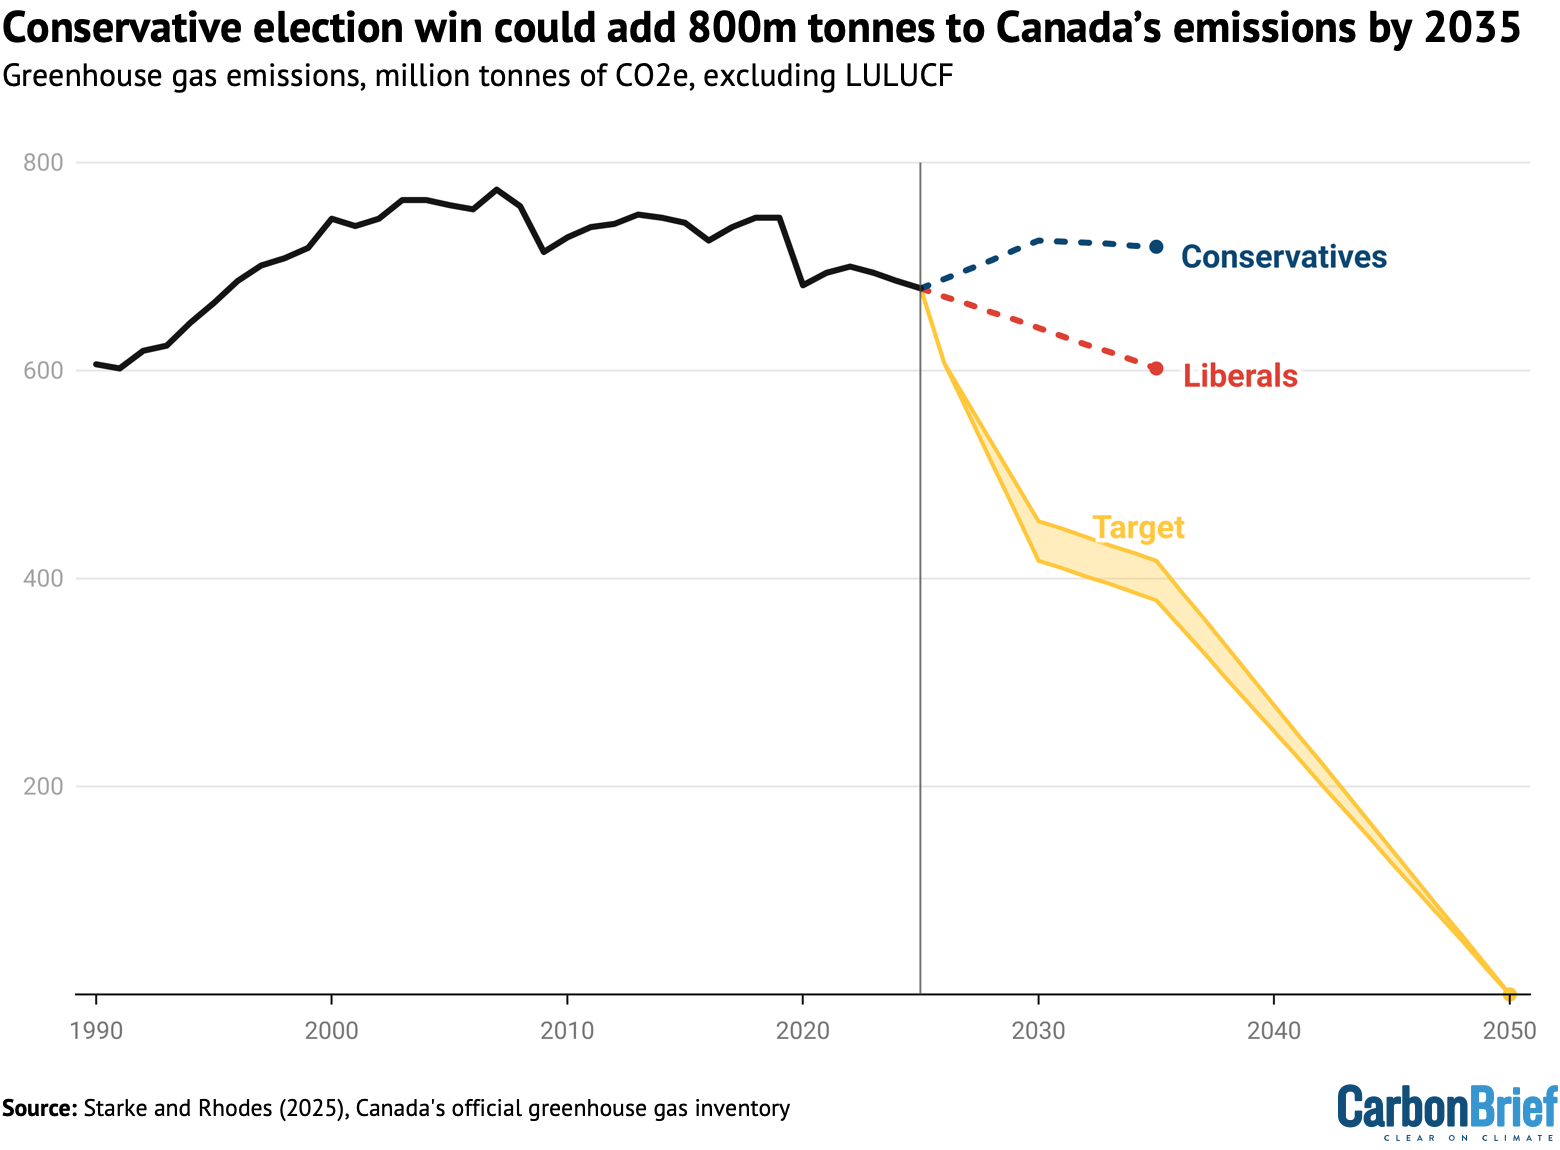
The impact of these rollbacks is illustrated by the “Conservatives” line in the figure below, based on the party’s climate-related announcements to date. Notably, Canada’s emissions would be expected to start rising again, reversing some of the recent decline.
The “Liberals” line is based on current federal policies, excluding the consumer carbon tax. It would see a continued, steady drop in emissions if the Liberals retain power, even if they fail to implement any new climate policies after the election.
As such, a Conservative victory could mean an additional 771m tonnes of carbon dioxide equivalent (MtCO2e) entering the atmosphere by 2035.
Along with the US, Canada has long calculated the “social cost of carbon” and other greenhouse gases, in order to place a value on any emissions changes resulting from new regulations.
Based on Carbon Brief analysis of the government’s own figures for this metric, the extra emissions released under a Conservative government could result in global damages worth C$233bn ($169bn).
The emissions trajectories out to 2035 are based on modelling carried out by climate scientists Emma Starke, a PhD researcher at Simon Fraser University, and Dr Katya Rhodes, an associate professor at the University of Victoria.
Starke and Rhodes simulated the policy platforms of the two major Canadian parties using the CIMS energy-economy model, a well-established tool for understanding the country’s federal climate policies.
The researchers ran the models out to 2035, twice the normal parliamentary term length, to reflect the timespan it can take for policies to significantly affect annual emissions.
Starke tells Carbon Brief the “simple message” of their work is that a federal Liberal government is “likely to continue reducing emissions while a Conservative government would see them rise significantly”.
If the Conservative party were to trigger such a reversal, Canada would be the only G7 nation with rising emissions.
The nation is already something of an outlier, with slower emissions cuts than most major global-north economies and per-capita emissions three times higher than the EU average.
Even in the “Liberals” scenario modelled by Starke and Rhodes, emissions would only fall to 1990 levels in 2035. Meanwhile, nations such as the UK and Germany have already roughly halved their emissions from 1990 levels, even as their economies have expanded.
§ Canada continues to miss targets
Canada has a net-zero target for 2050. Under the Canadian Net-Zero Emissions Accountability Act, it also has interim targets of cutting its emissions to 20% below 2005 levels by 2026, 40-45% by 2030 and 45-50% by 2035.
As the yellow lines in the chart above show, neither of the major Canadian parties has set out a policy programme that is sufficient to achieve the nation’s climate targets.
Emissions cuts from land use, land-use change and forestry (LULUCF), which count towards these targets, are not captured in the CIMS modelling of the two parties’ climate policies.
However, even when accounting for projected LULUCF emissions reductions, Carbon Brief analysis suggests a potential Liberal government’s annual emissions could be nearly one-third higher than the 2030 target.
Under a Conservative government, this gap could widen to more than 50% higher. (For more information about LULUCF estimates, see the Methodology.)
For context, the Conservatives’ gap in 2030 would be nearly equivalent to the entire annual emissions of Bangladesh. The Liberals’ gap in the same year would be roughly the size of Kuwait’s annual emissions.
This pessimistic outlook is supported by analysis from the Canadian government itself and independent analysts at the Canadian Climate Institute (CCI). Both have repeatedly shown that Canada is not on track to achieve its climate targets. (Analysts at Climate Action Tracker have also described Canada’s policies as “insufficient” to reach the world’’s Paris Agreement targets.)
This is confirmed by the most recent official projections, published by the government in December 2024 alongside Canada’s first “biennial transparency report” (BTR) to the UN.
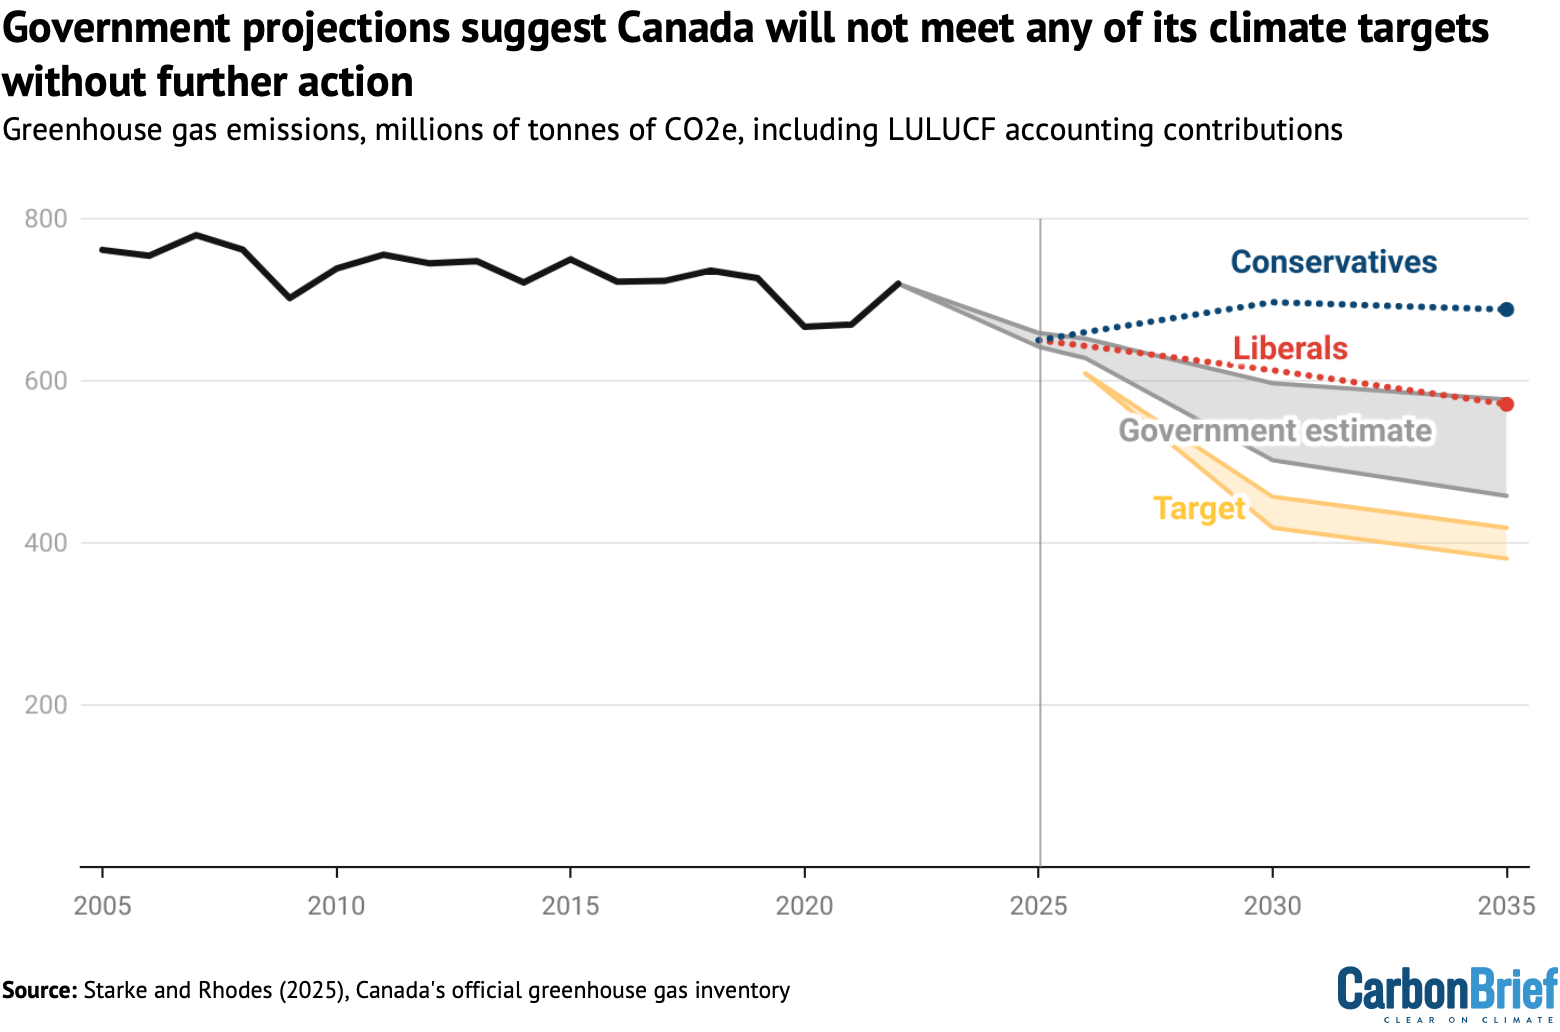
The chart below shows that neither of the main scenarios modelled by the government would be sufficient for Canada to reach its targets, meaning further policies would be needed to get on track.
Even in the government’s most optimistic scenario, Canada would only achieve an 18% emissions cut by 2026 – rather than the 20% being targeted – and a 34% cut by 2030, rather than 40%.
The “reference” scenario, shown by the upper grey line in the chart above, accounts for all federal, provincial and territorial policies that were in place by August 2024 and assumes no further government action. (This means it does not include more recent actions, such as scrapping consumer carbon pricing.)
The “additional measures” scenario, shown by the lower grey line in the chart above, includes extra measures that were announced, but not yet implemented.
It also includes extra emissions cuts from nature-based solutions, agricultural changes and a small number of international carbon credits purchased from the Western Climate Initiative. (Both scenarios also include accounting contributions from LULUCF.)
As the chart shows, the “Liberals” scenario modelled by Starke and Rhodes broadly aligns with the reference scenario, once LULUCF contributions are included. (This is despite Starke and Rhodes excluding the consumer carbon tax, see below.)
In the introduction to Canada’s 2024 BTR, Liberal climate minister Steven Guilbeault writes:
“We have more work to do to achieve our enhanced 2030 target of 40-45% below 2005 emissions.”
§ The parties’ climate platforms
In an election dominated by the growing economic threat from the US, climate change has not been seen as a key issue by either politicians or voters. (See Carbon Brief’s election manifesto tracker for more on how climate has featured so far.)
The modelling by Starke and Rhodes captures the impact of the climate policy proposals that have been announced by the Liberals and the Conservatives ahead of election day.
These mainly consist of Conservative commitments to eliminate parts of Canada’s climate strategy, citing high costs. Perhaps most significantly, the party has pledged to scrap industrial carbon pricing.
This policy involves setting limits on emissions from high-polluting businesses such as steel and fossil-fuel companies. Industries pay for emissions above a certain limit and can obtain saleable credits if they reduce their emissions below that limit.
Provinces and territories can set up their own pricing systems, but there is a federal backstop representing the minimum standards that are required.
Oil-producing regions have already moved to abandon industrial carbon pricing, challenging the federal government to enforce the backstop.
Canada’s climate policies overlap and complement each other in various ways, making it difficult to assign shares of emissions cuts to specific policies.
However, the CCI calculated in 2024 that industrial carbon pricing was set to be the “single biggest driver of emissions reductions” by 2030, accounting for 20-48% of emissions cuts expected over the next five years.
Consumer carbon pricing, commonly referred to simply as the “carbon tax”, is paid by households and small businesses on fuels such as petrol and gas. The CCI estimates that it would only have been responsible for 8-14% of emissions cuts by 2030.
Both parties have abandoned consumer carbon pricing and this is captured in the emissions trajectories modelled by Starke and Rhodes.
The Conservative election manifesto confirms earlier pledges to scrap a list of climate policies, which are also captured in the modelling. These include Canada’s electric vehicle sales mandate, clean-fuel regulations and clean-electricity regulations.
The electric-vehicle targets, part of Canada’s objective to phase out petrol and diesel vehicle sales by 2035, have been dismissed by Poilievre as a “tax on the poor” that result in people being “forced to pay” extra for electric cars.
Poilievre has referred to clean-fuel regulations, which are intended to boost hydrogen and other alternative fuels in the transport sector, as another form of “carbon tax”. Government estimates suggest these measures would cut emissions by 26MtCO2s annually by 2030.
Unlike these transport-related measures, the clean-electricity regulations are not set to kick in until 2035, so they make minimal difference to the two parties’ trajectories.
The Conservatives have also pledged to scrap the planned emissions cap on Canada’s oil-and-gas sector. The modellers left this out of their simulations, as it has yet to be legislated and there are still uncertainties about its implementation.
The modelling assumes that the Conservatives remove these climate policies and then do not replace them with anything else.
This may not be how things would play out. While the Conservatives are traditionally more opposed to climate action than the Liberals, they have not confirmed that they would withdraw from their national or international obligations altogether.
Indeed, Poilievre has described “technology, not taxes” as “the best way to fight climate change”, saying clean industries should be encouraged in Canada by expanding tax credits. Such proposals are not captured in this modelling.
Starke and Rhodes write that these would in any case have limited impact:
“We do not analyse the effect of various subsidies such as tax credits and grants because all political parties promise these and they have only a marginal effect on greenhouse gas emissions.”
There is also uncertainty around the impact an escalating trade war might have in Canada – including its fossil-fuel sector – as politicians seek to bolster domestic industries. This makes it harder to predict future emissions trajectories under the two parties.
The Conservatives have been more vocal about backing Canada’s fossil-fuel industry, but the Liberals have also expressed support for the sector, including pipeline projects. However, the lack of clarity on such measures mean they only have a “modest effect” in the CIMS modelling, according to Starke and Rhodes.
§ Methodology
The “Liberal” and “Conservative” scenarios in this article come from modelling by Emma Starke, a PhD researcher at Simon Fraser University, and Dr Katya Rhodes, an associate professor at the University of Victoria.
They used the CIMS energy-economy model to simulate the impact of removing key climate policies, in cases where parties have been clear about their intention to do so.
They did not account for policies that were deemed to have “only a marginal effect on greenhouse gas emissions” and focused on “key regulatory and pricing policies because these are the most important for reducing greenhouse gas emissions”. Their approach is outlined in an article for Policy Options.
The analysis uses the “medium growth scenario” from Statistics Canada forecasts of population and GDP growth.
In the first chart, Carbon Brief uses historical emissions data from Canada’s official greenhouse gas inventory, which at the time of publication includes figures up to 2023. Note that Canadian historical emissions data has undergone changes between years as the government has shifted its methodology. This results in differences between datasets.
Canada’s emissions targets use the baseline year of 2005, for example a 40-45% reduction from 2005. In the most recent inventory, annual emissions in 2005 were 759MtCO2e. This baseline year does not include emissions from LULUCF.
However, Canada can use “accounting contributions” from the LULUCF sector to meet its emissions targets. This involves using a “reference level approach” for managed forest and associated harvested wood products, meaning the government compares actual emissions and removals to a projected “reference level”. It uses a “net-net approach” for all the other LULUCF sub-sectors, meaning both emissions are removals are accounted for to get a net emissions figure.
For simplicity, Carbon Brief has left LULUCF contributions, which are relatively small, out of the historical emissions figures used in the first chart.
The CIMS modelling does not include emissions from LULUCF, so these are not included in the “Liberal” and “Conservative” emissions trajectories. However, in order to calculate the size of the emissions gap between the trajectories and Canada’s future targets, Carbon Brief simply added figures from government projections to these trajectories. These figures amount to emissions reductions of roughly 28-31MtCO2e annually from 2030 out to 2040.
In the second chart, Carbon Brief has used emissions data from the Canadian government’s most recent emissions projections, which appeared in its BTR, published at the end of 2024. These figures are slightly different from the ones in the most recent inventory, include LULUCF contributions and only go out to 2022.
Besides LULUCF contributions, the government reports separately on the impact of nature-based climate solutions, “agriculture measures” and credits purchased under the Western Climate Initiative (WCI), all of which are considered “additional measures” in its modelling. Nature-based solutions and “agriculture measures” cut another 12MtCO2e annually from 2030 onwards, whereas WCI credits are barely used. These figures are included in the “additional measures” government estimate in the second chart.