Guest post: Why 2023 was an exceptional year for Antarctic sea ice
While 2023 made headlines for smashing global temperature records, last year also saw some truly remarkable events in the Antarctic.
After crashing to a record-low summer extent in February, sea ice around the southern continent regrew extremely slowly.
By July, when sea ice should be approaching its maximum winter coverage, there was an area of ice “missing” that was bigger than Algeria – the world’s 10th largest country.
When the annual maximum extent arrived – early – it was the smallest on record by a “wide margin”.
This made 2023 the second record-breaking year in a row, continuing the recent erratic swings in sea ice cover that had otherwise been preceded by several decades of steady, gradual increase.
In our new paper, published in the Royal Meteorological Society’s journal Weather, my coauthor and I explore what happened to sea ice in 2023, what caused the dramatic events and what the implications are for the future.
§ The importance of Antarctic sea ice
Antarctic sea ice is a critical puzzle piece in the regional and global climate picture.
The frozen continent as a whole acts as the Earth’s principal refrigerator, reflecting the sun’s energy from its bright, white mirror-like surface, helping keep temperatures cool.
Sea ice formation around its coastline acts as an engine for ocean currents and influences weather patterns that can have far-reaching effects.
Floating ice also acts as a buffer that can protect the exposed edges of the ice sheet from the destructive action of waves, meaning that it can curb Antarctica’s contribution to sea level rise. By influencing the availability of water from the open ocean, it also affects how much snow can fall to replenish the ice sheet’s losses.
And sea ice is vitally important for marine life, as demonstrated by the “catastrophic breeding failure” of Emperor penguin chicks following the (then) record-low sea ice coverage in 2022.
§ Long-term trends
Thanks to satellite data, scientists have a detailed picture of how Arctic and Antarctic sea ice have behaved since the late 1970s. And for Antarctica, this picture has been something of a puzzle.
Between 1979 and 2015, average Antarctic sea ice extent – the area of ocean with at least 15% sea ice cover – increased slightly, but fairly steadily. This is in stark contrast to the Arctic, where sea ice at the minimum summer extent plummeted by nearly 12% per decade.
Then, after a record high year in 2014, Antarctic sea ice extent dropped to a record low in 2017. Several years of low sea ice came after that, with the summer minimum record smashed in 2022, when it fell below 2m square kilometres for the first time.
§ How extreme was 2023?
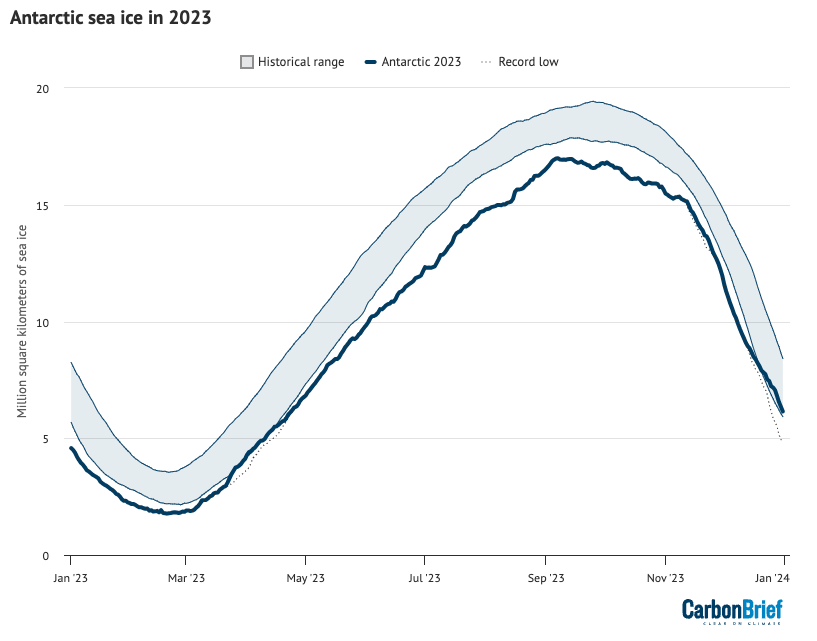
Antarctic sea ice waxes and wanes throughout the year, reaching a minimum in February at the end of the southern-hemisphere summer and a maximum in September after a long, cold winter.
This seasonal expansion causes the area covered by sea ice to grow six-fold within a single year – as the chart below shows. It depicts Antarctic sea ice extent for each day of 2023 (blue line), along with how it compares to the historical range (blue shading) and the record low for the time of year (dotted line).
As the chart shows, 2023 was an exceptional year in the satellite record, remaining well below average for the entire year.
The year started with a record-breaking minimum extent of 1.79m km2 in February 2023, which was 10% lower than the already record-breaking 2022.
Although the autumn freeze-up started off as usual, from April the seasonal expansion of sea ice was very slow. By July, the total sea ice extent was 13.5m km2 – 15% lower than average for the month.
The area of “missing” sea ice for the month of July, relative to the 1981–2010 average, was nearly two-and-a-half million square kilometres (specifically, 2.47m km2) – an area larger than Algeria.
The period of extreme departure from average persisted from mid-May until mid-November, with conditions recovering a little, meaning that by the end of the year, they were no longer record-breaking.
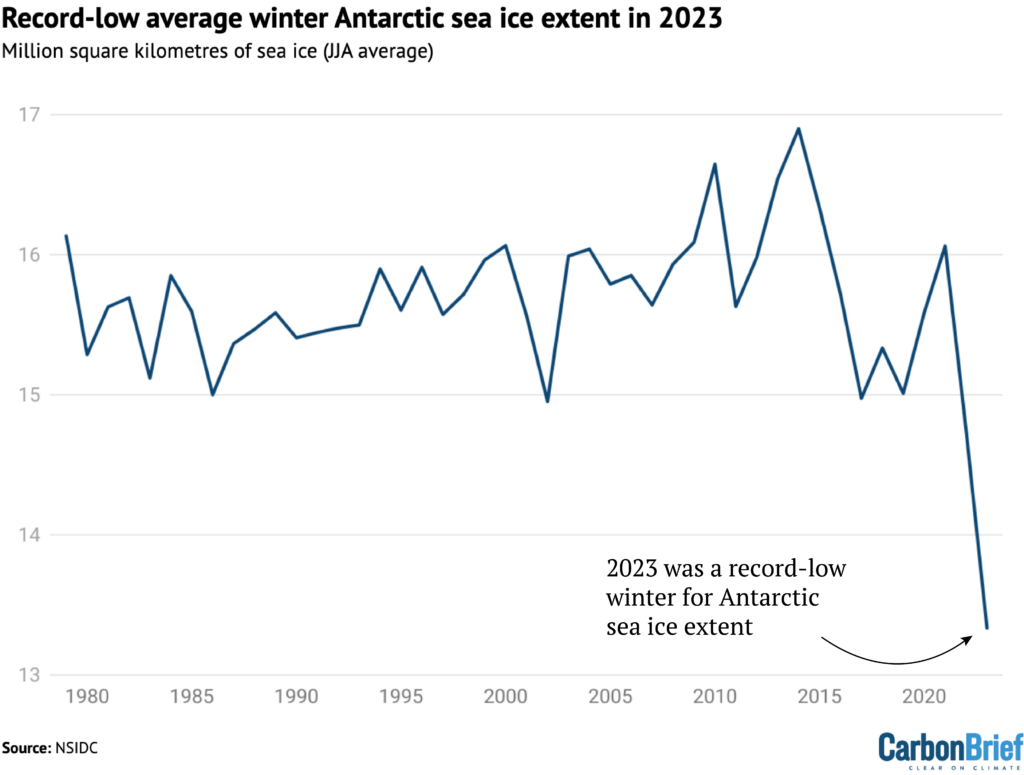
Overall, the largest deviations from average conditions in 2023 were recorded in winter (June to August). To see this in context, the chart below shows winter sea ice extent from 1979 to 2023 and highlights how dramatically low winter sea ice was last year.
In addition, the table below shows the average winter sea ice extent and the anomaly – that is, the departure from the 1981-2010 average. It is clear that at 2.34m km2, the anomaly in the winter of 2023 was larger than in any other year. The next largest was 0.93m km2 in 2022.
| Year | JJA mean extent (million km2) | JJA anomaly (million km2) |
|---|---|---|
| 2023 | 13.34 | -2.34 |
| 2022 | 14.75 | -0.93 |
| 2002 | 14.95 | -0.73 |
| 2017 | 14.97 | -0.71 |
| 1986 | 15.00 | -0.69 |
§ Drivers of low sea ice conditions
There is no single cause of record-low sea ice conditions, but it is likely that a combination of oceanic and atmospheric factors conspired to produce 2023’s record sea ice conditions.
Recent studies have pointed to the important role of ocean processes and heat stored below the surface, which have kept sea ice extent low since 2016. Warm sea surface temperatures in the Southern Ocean during the first half of 2023 probably also partly explain both the record minimum extent in February and the slow freeze-up afterwards.
But Antarctic sea ice is also closely controlled by atmospheric circulation. One such circulation pattern is the Amundsen Sea Low, which is a low-pressure weather system that consistently forms off the coast of West Antarctica. Exactly where it is and how low the atmospheric pressure gets can control winds and temperature in the region, impacting the movement, breakup, formation and destruction of sea ice.
The pattern in sea ice in 2023 was closely tied to the behaviour of the Amundsen Sea Low, which was unusually deep and far to the east in winter when the sea ice anomalies were at their peak.
This situation tends to blow warm air towards the coast and push sea ice back, limiting sea ice growth during the freeze-up season.
Other large-scale weather patterns – such as the Southern Annular Mode and El Niño-Southern Oscillation have historically contributed to the ups-and-downs observed in Antarctic sea ice, but they do not seem to have had a major influence in 2023.
These weather patterns can interact to either amplify or suppress sea ice changes by affecting the ways that sea ice moves, melts and freezes.
§ Links with climate change
Deciphering the role of climate change in Antarctic sea ice trends is much more complicated than in the Arctic because conditions are impacted by so many competing factors.
However, the sheer magnitude of 2023’s sea ice lows suggests that something unusual is happening.
Sea ice conditions during 2023 were far outside the bounds of normality, but it is difficult to say exactly how far. That is because the satellite record is relatively short (45 years) and the system is highly variable. In addition, climate change is already impacting the Southern Ocean in complex ways, making an estimation of what is “normal” impossible.
Climate models project a decline in Antarctic sea ice in response to greenhouse gas emissions and rising temperatures. However, until 2015 this prediction was largely at odds with what scientists were seeing – in part due to the complexity and uncertainty of the processes involved, and the impractically high detail required to accurately represent sea ice in models.
However, despite their limitations, it seems inescapable that models will ultimately be correct about Antarctic sea ice decline. Human emissions are raising temperatures in the Southern Ocean, and studies show a link between ocean warming and low Antarctic sea-ice extents.
Several papers – including one discussed in a previous Carbon Brief guest post – have argued that recent record-low sea ice years may be a taste of what is to come.
With 2024 likely to be another year of high global average temperatures and weather extremes, it may emerge as another year of low Antarctic sea ice. Although current sea ice extent is no longer the lowest on record, conditions are still well below the 1981-2010 average, and this situation may well persist into the 2024 melt season.
So, while it is too early to say conclusively that the recent sea-ice lows are the beginning of a regime shift in Antarctic sea ice, it seems inevitable that it will eventually decline in response to human-caused climate change.
For now, all scientists can say for certain is that the events of 2023 were entirely remarkable and unlike anything seen in the satellite record.