New statistics show world’s tentative steps towards low carbon energy
Europe’s green fields are becoming dotted with wind turbines, North American cars are chugging biogas rather than oil, and China’s rooftops are ever more adorned with solar panels. Everywhere, there are signs that the world is undergoing a clean energy revolution. But for all politicians’ talk of the “promise of clean energy”, new data shows the world is still heavily reliant on fossil fuels.
While countries are taking tentative steps down a path to a low carbon energy sector, BP’s annual statistical review shows just how long that road could be. We take a look at some of the potential obstacles ahead.
Curbing consumption
Policymakers are increasingly touting energy efficiency as a strategy to improve energy security and curb emissions. But BP’s data shows that whatever progress rich countries are making to reduce demand is largely being cancelled out by energy-hungry developing economies.
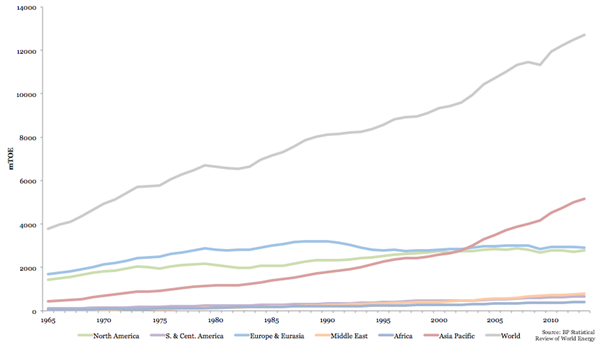
BP says global energy consumption increased by 2.3 per cent in 2013, continuing a long-term trend of growing energy demand – as the grey line on the graph below shows. Emerging economies were responsible for around 80 per cent of that increase, it reports.
Image - BP Stats Global Consumption Blog (note)
The data shows South and Central America, the Asia Pacific and Middle East combined were responsible for about 56 per cent of energy consumption. North America and Europe consumed around 20 per cent of the world’s energy each.
The IEA says that if energy demand continues to grow at this rate, the world is on track for almost four degrees of warming – so implementing energy efficiency policies will be key to curbing emissions. But Europe was the only region to see demand decrease compared to the year before – by about 0.3 per cent.
So as it stands, policymakers must do much more to reduce demand worldwide if energy sector emissions are to be curbed.
Accelerating renewables
As well as reducing demand, policymakers must ensure renewables provide for much more of the world’s energy needs. For all renewable energy’s growth, BP’s data shows most of the world’s energy demand is met by fossil fuels.
That’s a problem, because the IEA says energy sector emissions must be halved by 2050 for the world to avoid significant global warming.
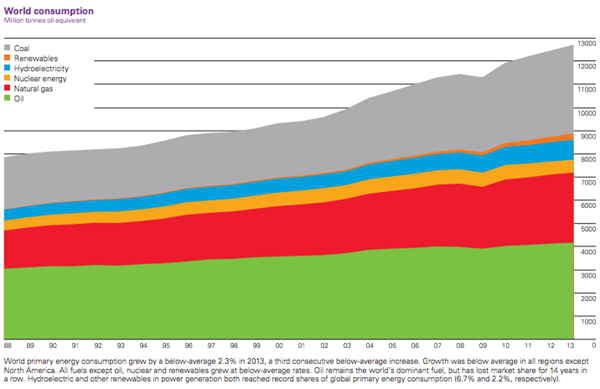
Renewable energy was responsible for record levels of consumption in 2013, according to BP’s stats. But demand for coal, oil and gas also increased. Oil remained the world’s most-used fuel in 2013, providing for about 33 per cent of consumption. Coal consumption was around 30 per cent of the total, and gas consumption about 24 per cent.
Compare the orange slice in the chart below to the others to see just how small renewables’ share in global energy consumption still is:
Image - BP World Consumption (note)
There is another way to look at the trends which provides a more optimistic picture of renewables’ contribution, however.
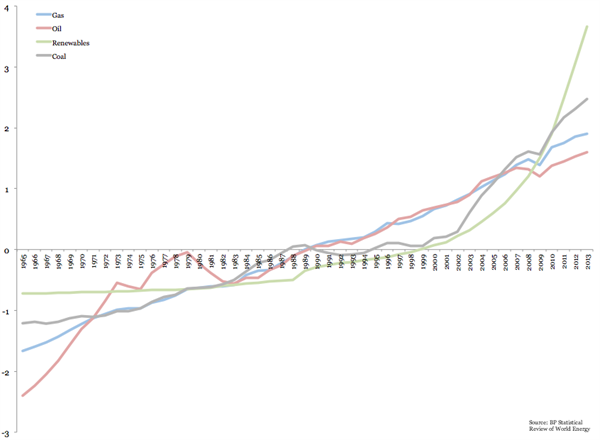
The graph below shows how much of each fuel was consumed compared to its own average over the 38 years of available data – a trick called standardisation. While renewable power only accounts for a fraction of global energy use, its by far the quickest growing energy source.
The numbers on the y-axis aren’t particularly important. What’s informative is the steepness of the lines:
Image - BP Stat Review Standardised Fuels Blog (note)
The graph shows gas (the blue line) and oil (red) consumption has been growing at a fairly steady pace since the mid 1960s, as the lines are reasonably flat.
It’s a different story for renewables, however. Renewable energy consumption has increased very quickly since the turn of the millenium, as the steepness of the green line shows. Coal consumption (in grey) underwent a similar uptick since the early 2000s after flatlining through the 1990s.
Policymakers must ensure renewables keep growing at such a pace – while turning the coal line downwards – if they are to sufficiently curb energy sector emissions.
Cutting emissions
Unsurprisingly, as consumption increased and countries burned fossil fuels to meet demand, energy sector emissions also rose. The data shows that if policymakers are serious about curbing emissions, they’re going to have to ramp up efforts to decarbonise the energy sector – and fast.
In one of only two mentions of the word “emissions” in the review, BP points out that energy sector emissions accelerated in 2013 – though at a below average rate.
BP’s statistics also reveal a more positive story for the climate, however: emissions for each unit of energy consumed – also known as emissions intensity – fell. The reduction was slight, however. Global emissions intensity was about 0.02 per cent lower than a year before thanks to more efficient power stations and a slight increase in the use of less polluting energy sources.
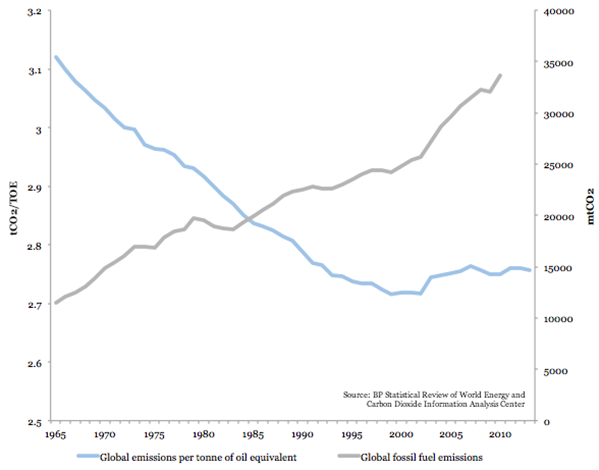
Emissions intensity has fallen considerably in the last 40 years or so, as the blue line on the graph below shows. But the current intensity level has recently risen thanks to countries burning more coal and oil, the two most polluting fossil fuels. The intensity level is now about the same as it was in the early 1990s – not great progress.
Image - BP Stat Review Emissions Blog 2 (note)
At the same time, global emissions from fossil fuels have continued to rocket as demand increases (the grey line). On current trends, the world will soon pass the point at which it can avoid significant warming without extracting emissions from the atmosphere.
So if policymakers are serious about tackling climate change, they need to step up efforts to decarbonise the energy sector, ensuring that grey line takes a steep downward turn soon.