The three trends cutting US emissions
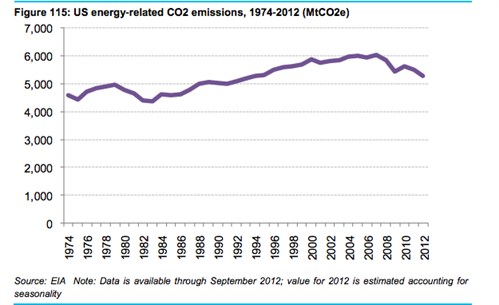
The US’s energy sector emissions went down by a pretty impressive 13 per cent between 2007 and 2012, according to new analysis, reaching their lowest level since 1994. What’s behind it? Energy efficiency, gas and renewables.
US emissions
Bloomberg New Energy Finance’s Sustainable Energy in America Factbook 2013 tracks what it calls a revolution in the US energy sector, leading to an “about face for the country’s emissions trajectory”.
Image - Screen Shot 2013-02-04 At 14.55.05 (note)
In its story on the research, the Guardian led on the contribution of energy efficiency and the US’s renewables sector to the dip in emissions, but the Bloomberg report also credits an increase in gas-powered generation, with cheaper unconventional gas making it economic to switch away from more polluting coal.
Both renewables and natural gas are increasing their share in the US energy mix, while coal and oil have significantly declined, according to Bloomberg.
So what’s driving the US energy revolution?
Efficiency
Energy efficiency is one of the report’s big stories. Advances in the sector have largely driven a whopping 6.4 per cent drop in total energy use between 2007 and 2012, according to Bloomberg’s preliminary estimates.
The report says the introduction of smart grid technologies are helping to improve grid management – 46 million smart meters have been deployed in the US, and spending on smart grid rollouts grew from $1.3 billion in 2008 to $4.3 billion last year. Demand response capacity – the ability to cut down on electricity consumption at peak times – has grown by “more than 250 per cent between 2006 and 2011”, Bloomberg says.
The biggest energy reduction came from sectors outside electricity, Bloomberg says. The increasing popularity of smaller, more economical vehicles mean oil consumption has gone down since 2005. And buildings are also becoming increasingly efficient. For example, Bloomberg says commercial buildings’ energy intensity decreased by over 40 per cent since 1980. This means gas consumption has not gone up in the housing and commercial buildings sector, the report says.
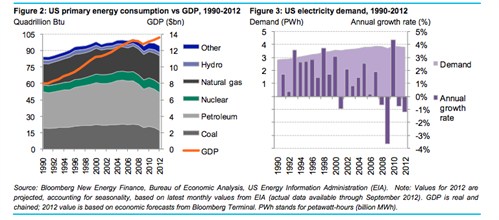
Despite these energy use reductions, what makes the fall in emissions perhaps more remarkable is that GDP has actually gone up by three per cent since 2008 , as the tables below show:
Image - Screen Shot 2013-02-05 At 10.07.41 (note)
Gas
According to Bloomberg, natural gas provided the US with 27 per cent of its total energy supply in 2012. Gas produced 31 per cent of US electricity in 2012 – that’s up from from 22 per cent in 2007.
Even though total energy consumption is down, gas use is on the rise. It’s the huge increase of shale gas in the country’s energy mix that has helped keep prices low. As natural gas production in the US has grown by around 14 billion cubic feet a day, or around 25 per cent over the past five years, “demand has struggled to keep up”.
Gas generation looks set to continue to replace coal. According to Bloomberg, Environmental Protection Agency rules requiring coal stations to install expensive new equipment to reduce their emissions will force huge numbers of coal plant into retirement. Bloomberg predicts that coal is on the way out – gas-fired generation stands to almost completely take the place of retired coal plants.
Gas still emits carbon dioxide, but it emits about half the amount that coal does. So even though the amount of carbon dioxide emissions from gas has increased in 2011, coal’s demise has “more than offset” this rise, Bloomberg says. The graph below shows how this works:
Image - Screen Shot 2013-02-04 At 14.51.26 (note)
Renewables
Meanwhile, renewables including hydropower supplied 9.4 per cent of total energy and 12.1 per cent of electricity in 2012 – very roughly a third of the amount produced by gas.
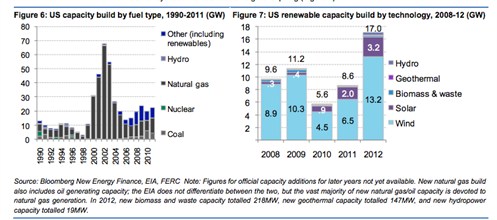
According to Bloomberg, renewables were the largest source of new capacity, with 17 gigawatts added to the grid last year, the majority of which came from wind power. Cumulative installed renewable capacity nearly doubled between 2008 (44GW) and 2012 (86GW).
Renewables and energy efficiency also attracted a fair amount of investment in 2012 – $44.2 billion in 2012, although that’s a 32 per cent decline on 2011.
Image - Screen Shot 2013-02-05 At 10.11.40 (note)
What’s causing the dip?
There’s been a fair amount of speculation about whether shale gas is behind the dip in US emissions or not. A recent Guardian piece lays out the competing arguments:
“In May, the International Energy Agency claimed that annual US emissions fell by 1.7% in 2011 ” primarily due to on-going switching from coal to natural gas in power generation and an exceptionally mild winter.” The coal-to-gas switch has been driven by gas prices that are falling due to large volumes of shale gas. But a new analysis of US government energy data by Greenpeaces’s upcoming energy news site, Energydesk shows renewable energy in fact played a bigger role than gas in cutting climate-warming gases.”
But Bloomberg’s analysis appears to show that both renewables and gas played an important role in the emissions reduction – with an important contribution from energy efficiency, which often gets forgotten in the frenzy to compare energy generation technologies.
Grant McDermott at the Norwegian School of Economics, who writes for climate and energy economics blog REConomics, says:
“[The report] undeniably supports that notion that gas has played a significant part in the reduction of US emissions – even if that role seems to have been overstated by some pundits.”
Given the shift to shale gas, commentators such as economist Dieter Helm have highlighted the fact that the US is managing to reduce its emissions without a clear countrywide climate policy. But as we wrote last year, other pundits have warned US emissions could just as easily go up again if the market changes and there are no policies to block a move back towards coal.
US coal: Under-priced, over-carbonated, and over here
Meanwhile, on this side of the Atlantic 2012 was a very different year for EU emissions.
In contrast to the US, last year saw greenhouse gas emissions from Europe’s coal stations go up by as much as 17 per cent, again according to Bloomberg New Energy Finance in the Financial Times yesterday. In total, emissions from Europe’s power sector are expected to have increased by three per cent, the article says.
Bloomberg spokesman Brian Potowski told the FT:
“I would say that the increase in power emissions is due in large part to the increased attractiveness of burning coal relative to gas in 2012.”
The new statistic highlights one of the rather less beneficial results of the change in the US’s energy mix – a significant increase in the amount of coal the country exports around the world.
But as we wrote yesterday, if coal really is driving the increase in EU emissions, the trend may not continue for long. This is mostly due to regulations similar to those in the US that will lead to the retrofitting or retiring of many of the EU’s coal stations. Europe’s cap and trade system means that even if coal use spikes over a couple of years, total emissions can’t go up too much, according to McDermott – so even though the EU ETS is currently experiencing low carbon credit prices, climate policies may yet help to mitigate the worst effects of the EU’s dirty fling with coal.
Good news? Perhaps. Overall, it doesn’t look like much is going to stop the general fall in rich countries’ emissions. But what goes for the US and the EU probably doesn’t for the rest of the world. With India and China in particular enthusiastically embracing coal, a dramatic rise in poorer countries’ emissions as they grow their economies seems unstoppable – for the moment.
Update 07/02/2013: We’ve amended the first paragraph to clarify that the reduction in emissions occurred between 2007 and 2012. It originally said the dip had occurred last year.