More ice than last year is still bad news for the Arctic
Compared to last year, this summer’s Arctic melt season has been less severe – leading some people to claim sea ice is rebounding from decades of thinning and shrinking. But as a look at satellite data reveals, this year’s ice cover is still tracking well below average – meaning ice in the Arctic still faces long term decline.
Summer sea ice
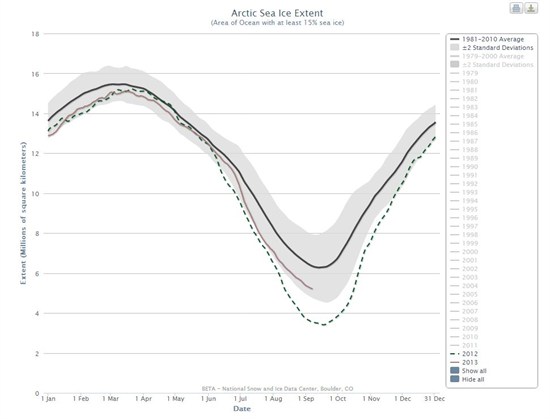
Based on the amount of ice present today, it’s unlikely the ice-covered area of ocean will shrink below last year’s record low. That area isn’t expected to reach its minimum for another week or two, but at the moment there’s 5.14 million square kilometers of ice. On the same date last year, just 3.51 millions square kilometers remained.
The graph below shows how ice extent this year and last year compares:
Scientists say the weather is the main reason more ice has stuck around this summer.
Last summer was unusual – warm temperatures helped melt the ice, while a summer cyclone helped break the ice up and disperse it. These weather conditions, plus the long term warming trend, resulted in the lowest levels of sea ice seen since satellite records began in 1979.
Different weather patterns mean temperatures in the Arctic have been much cooler this summer, however, and have meant less ice has broken up and drifted away.
Big year-to-year fluctuations in sea ice are becoming commonplace in the Arctic, because recent decades of rising temperatures have thinned the ice, making it much more vulnerable to changes in the weather. Even though a layer of ice regrows each winter, it melts much more easily under the right conditions in the summer.
Arctic ice decline continues
Despite the fact there’s been some recovery, the graph above also shows sea ice levels in the Arctic are still below average this year. And that means the long term trend of sea ice decline is continuing. There are a number of different ways of measuring sea ice, and they all agree there’s a downward trend.
Probably the most commonly used measurement is sea ice extent – the area of the ocean covered in ice, including the bits where the ice cover is a bit patchy. Satellites have been recording this information since 1979, and a number of space & science agencies keep track of it.
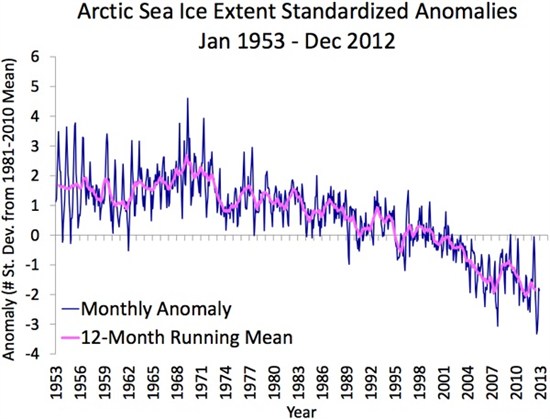
With maps and photos filling the gap back to 1953, this satellite data indicates Arctic sea ice has been declining since at least the early 1950s:
Image - Arctic Sea Ice Anomaly (note)
Arctic sea ice extent relative to the 1981-2010 mean (marked as the x-axis). Source: NSIDC
In recent years, satellite missions calculating the volume of sea ice have become popular. These satellites use radars to measure the thickness of the ice – information which can be combined with ice extent data to calculate volume.
Volume measurements give an even clearer picture of how the Arctic is changing, because they tell you not just how much ice is visible at the surface, but how deep that ice is too.
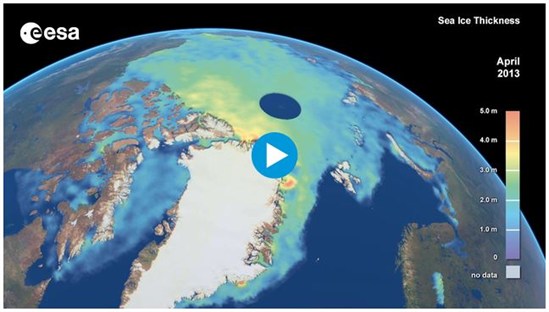
Brand new data from the European Space Agency (ESA) shows that since its satellite missions began in 2010, the volume of Arctic sea ice has been shrinking. As the video below shows, sea ice cover is smaller and thinner in both winters and summers:
NASA also ran a similar mission between 2003 and 2008 to map changes in sea ice volume. Over those five years, NASA’s satellites also saw the Arctic ice shrink.
The drawback with ice volume data is that the record is pretty short – NASA’s mission ran for five years, and ESA’s has only been going for three so far. Eight years of data is not really enough to look for trends.
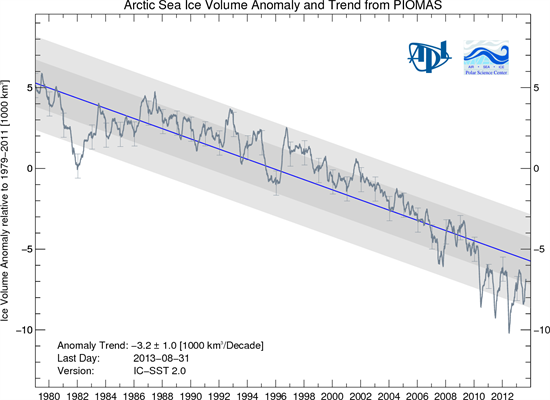
The data helps scientists confirm that their models of sea ice volume are doing a pretty good job of replicating changes in the Arctic, however. The best known model of sea ice volume, called PIOMAS, agrees there’s a long term decline:
Image - Ice Volume - PIOMAS (note)
Better than last year is still bad
Some skeptics suggested that because this year’s ice cover is higher than in 2012, Arctic sea ice is rebounding.These claims ignore the fact that ‘better than last year’ is still bad news, however.
As Carbon Brief discussed earlier this week, satellite data does show that in August 2013, Arctic sea ice extent average 2.35 million square miles. That’s 919,000 square miles bigger than August last year – an increase of about 60 per cent.
But as the ice volume and ice extent graphs show, natural fluctuations in the climate mean sea ice cover can rise and fall from one year to the next while still being in long term decline.
When Arctic sea ice reaches its annual low in a few weeks time, it will still be well below average, and certainly more worrying than terms like ‘rebound’ would suggest.