Wind and solar are ‘fastest-growing electricity sources in history’
Wind and solar are growing faster than any other sources of electricity in history, according to new analysis from thinktank Ember.
It says they are now growing fast enough to exceed rising demand, meaning there will be a peak in fossil fuel electricity generation – and emissions – from this year.
As a result, Ember says in its latest annual review of global electricity data that a “new era of falling fossil fuel generation is imminent”.
Renewables met a record 30% of global electricity demand in 2023 and emissions from the sector would already have peaked if not for a record fall in hydropower, the analysis says.
The rise of wind and solar has been stemming the growth of fossil fuel power, which would have been 22% higher in 2023 without them, Ember says. This would have added around 4bn tonnes of carbon dioxide (GtCO2) to annual global emissions.
Nevertheless, the growth of clean electricity sources needs to accelerate to meet the global goal of tripling renewables by 2030, Ember says.
Meeting this goal would almost halve power sector emissions by the end of the decade, and put the world on a pathway aligned with the 1.5C climate target set in the Paris Agreement.
Clean capacity expansion↫
In 2023, more than twice as much new electricity generation from solar was added around the world as from coal, Ember says.
The share of solar within the global energy mix reached 5.5%, up from 4.6% in 2022, according to Ember. The share of wind stayed steady at 7.8% (2,304 terawatt hours, TWh).
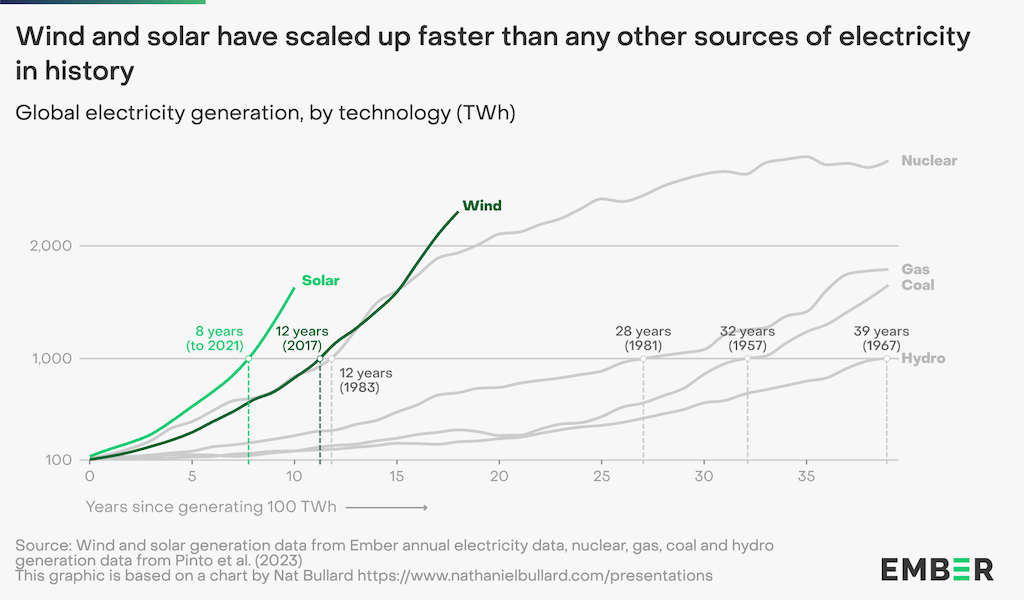
No other sources of electricity generation have ever grown from 100TWh per year to 1,000TWh faster than solar and wind, Ember says. These took just eight and 12 years respectively, as shown in the figure below.
This sits far ahead of gas generation at 28 years, coal at 32 years and hydropower at 39 years. (Nuclear also grew from 100TWh to 1,000TWh over 12 years, the Ember figure shows, but tailed off more quickly than wind).
In response to Ember’s report, Dr Hannah Ritchie, deputy editor at Our World in Data, says in a statement:
“The main headline from Ember’s 2023 review is that the world sees a bright future for solar power. It is consistently breaking records and maintains its position as the fastest-growing power source in history. This is not only driven by the need to move to clean energy, but by its exciting economics as prices continue to fall. There are early signs that a peak in power sector emissions is imminent. Faster growth in low-carbon energy will be needed to drive down emissions quickly, especially as countries electrify transport, heating and industry.”
Despite solar and wind capacity growth in 2023, generation grew more slowly than expected, rising by 513TWh – a small drop from the 517TWh added in 2022.
Solar generation growth lagged behind record high capacity addition growth of 36%, due to lower sunlight levels in 2023, especially in China, as well as underreporting of solar generation in some countries. This is expected to be temporary, notes Ember.
For wind, there was a fall in generation for the first time since 2001, down 9.1TWh or 2.1%. Low wind conditions kept load factors close to their lowest level in five years, Ember says.
Additionally, higher costs slowed wind capacity additions as developers were forced to delay or cancel projects. More than $30bn in investment was put on hold as at least 10 offshore wind projects in the US and Europe were hit by delays, the Wall Street Journal reported for example.
In other renewables, hydropower’s share of the electricity mix fell by 0.6 percentage points to 14.3% of the world’s electricity mix, Ember reports. It therefore remains the world’s largest source of clean power, but its share of the mix is now at the lowest since at least 2000, with wind and solar combined sitting just 1 percentage point behind at 13.4% (3,935TWh) .
This is despite 7GW of new hydropower capacity coming online in 2023, according to the International Renewable Energy Agency (IRENA).
Ember had previously estimated that there would be a 0.4% reduction in global power sector emissions in 2023, but the fall in hydropower generation prevented this. Instead, emissions from the power sector rose by 1%, as the hydro shortfall was mostly met by coal.
Wind and solar have expanded from 0.2% of the global electricity mix in 2000 to 13.4% in 2023. Over the last year, their share grew by another 1.5 percentage points, up from 11.9% in 2022.
Demand rises to a record high↫
While wind and solar were rising fast, 2023 also saw global electricity demand reaching a record high, with an increase in demand of 627TWh, Ember reports. This is the equivalent of adding the entire demand of Canada (607TWh), for example.
With wind and solar having grown by 513TWh in 2023 and nuclear by 46TWh, but hydro falling 88TWh, the remaining demand growth was met by increased fossil fuel use.
This continued the trend of recent years where the gap between clean power growth and rapidly-rising demand was met by expanded electricity generation from fossil fuels.
Moreover, last year’s increase in demand was below the recent average, rising by 2.2%. This was due to a pronounced decrease in demand from OECD countries, including the US (-1.4%) and the European Union (-3.4%).
Elsewhere, there was rapid growth in electricity demand in China, growing nearly 7%. This was the equivalent of the total global demand growth in 2023, Ember notes.
Looking ahead, demand is likely to grow even faster as energy use is increasingly electrified. Already more than half of global electricity demand growth in 2023 was driven by the rise of electric vehicles (EVs), heat pumps, electrolysers, air conditioning and data centres, the report states.
According to the International Energy Agency (IEA), nearly 14m EVs were registered globally in 2023, bringing the total number on the roads to 40m. This puts electric car sales last year at 3.5m higher than in 2022, a 35% year-on-year increase.
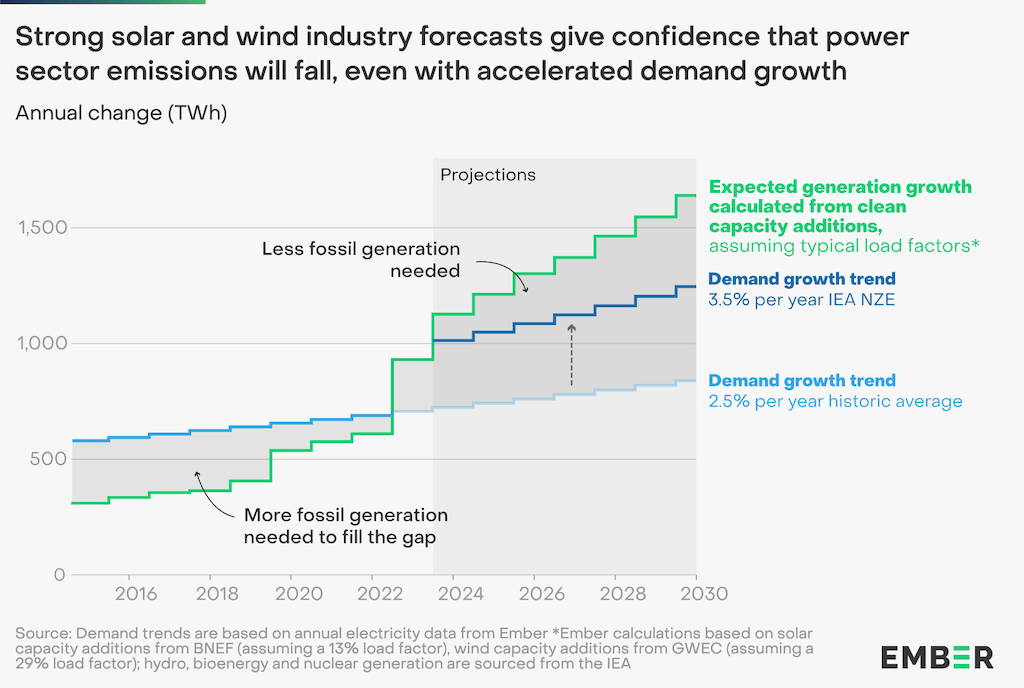
Ember forecasts that electricity demand will accelerate significantly going forwards, with a growth of 968TWh expected in 2024. Even faster growth would be expected on a path to staying below 1.5C under the IEA’s “NZE” scenario, it notes.
Yet clean electricity generation is expected to grow faster still, with wind,solar and other clean energy sources adding an estimated 1,300TWh in 2024, as shown in the chart below.
This would be more than double the increase in 2023 (493TWh), due to an expected uplift in the US from the Inflation Reduction Act and a reversal in short-term factors such as last year’s hydro drought, the report says.
As a result of this, Ember estimates that fossil generation will decline by 333TWh or 2% in 2024. Even more importantly, Ember says clean energy growth makes ongoing falls in power sector fossil fuel use “inevitable” – meaning a steady decline in related emissions.
Christiana Figueres, former executive secretary of United Nations Framework Convention on Climate Change and founding partner of Global Optimism, says in a press statement:
“The fossil fuel era has reached its necessary and inevitable expiration date as these findings show so clearly. This is a critical turning point: Last century’s outdated technologies can no longer compete with the exponential innovations and declining cost curves in renewable energy and storage. All of humanity and the planet upon which we depend will be better off for it.”
Tripling renewables and what comes next ↫
At the COP28 UN climate conference in Dubai in 2023, all countries agreed to contribute to the tripling of global renewable energy capacity by 2030, in what was seen as a “crucial” step for 1.5C.
Although the COP28 outcome did not include numerical targets, Ember says tripling renewables would mean adding 14,000TWh of annual renewable generation by 2030, compared to 2022 levels. In 2022, renewables accounted for 8,599TWh of the 28,844TWh of electricity generated globally.
After accounting for rising electricity demand, it says this tripling would help cut fossil fuel generation by 6,570TWh, or 37%. With highly-polluting coal power bearing the brunt of this reduction, power sector emissions would fall even faster, by 45% in 2030, it says.
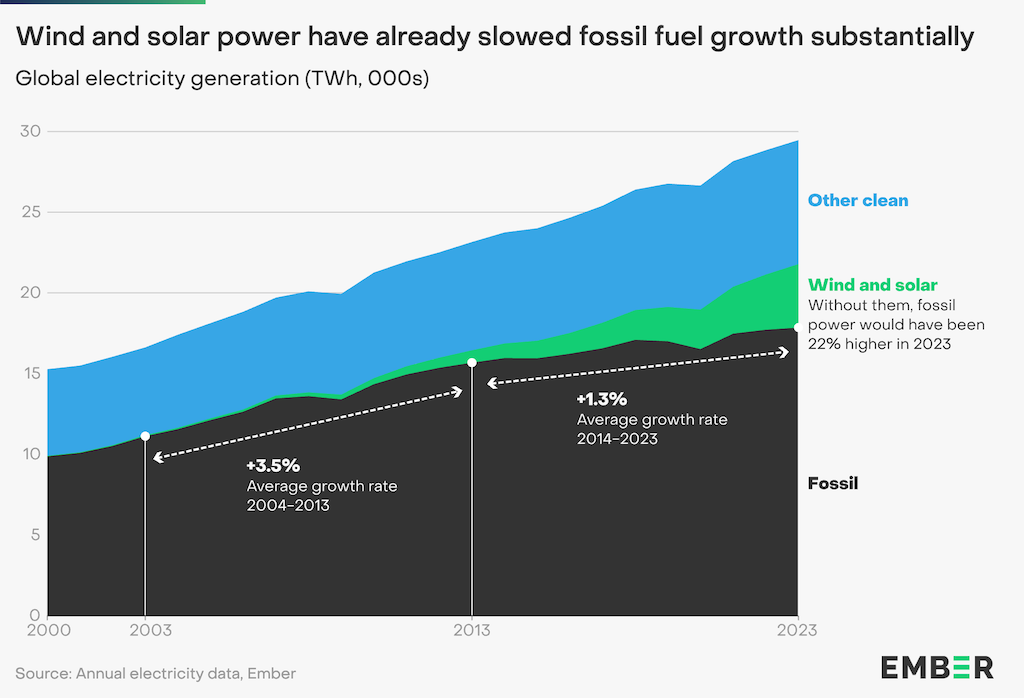
Already, the expansion of renewable energy has slowed fossil fuel growth substantially, as the graph below shows.
After recording average annual growth of 3.5% over the decade 2004-2013, fossil fuel generation only grew by an average of 1.3% in the decade to 2023.
Fossil fuel generation was 22% lower in 2023 than it would have been without solar and wind generation. Between 2015 and 2023, wind and solar have together avoided more than 4GtCO2 emissions, Ember notes.
Meeting the tripling goal would mean some 60% of global electricity supplies coming from renewable sources by 2030.
This would mark a dramatic shift from current renewable shares. In 2023, 102 countries had a renewable generation share of 30% or higher, up from 98 in 2022. Yet only 69 countries in 2023 had a share in excess of 50%.
Hitting the tripling target would help put “the world on a pathway aligned with the 1.5C climate goal”, says Ember.
Ember’s director of global insights, Dave Jones says in a statement:
“We already know the key enablers that help countries unleash the full potential of solar and wind. There’s an unprecedented opportunity for countries that choose to be at the forefront of the clean energy future.”